Welcome to the ProLUG Enterprise Linux Systems Administration Course Book.
This Book
Contains all materials pertaining to the course including links to external resources. It has been put together with care by a number of ProLUG group members referencing original instructional materials produce by Scott Champine (het_tanis).
The content is version controlled with Git and stored here: https://github.com/ProfessionalLinuxUsersGroup/lac/
Furthermore, the book has been built with mdbook for ease of navigation. Be sure to try the search functionality.
Course Description:
This course addresses how the Linux systems work for administration level tasks inside a corporate environment. This course will explore everything from the administration of a Linux server and fundamental command line tasks to advanced topics such as patching and web administration.
Prerequisite(s) and/or Co-requisite(s):
Prerequisites: None
Credit hours: N/A
Contact hours: 120 (50 Theory Hours, 70 Lab Hours)
Course Summary
Major Instructional Areas
- Server build and Hardware components
- Command Line tools and Syntax
- Basic Scripting
- Linux networking
- Linux security practices
- Automation and repeating tasks
- Implement Networking in Linux
- Troubleshooting
- Benchmarking and Baselining
Course Objectives
- Explain the server build process and hardware system components.
- Analyze system security and implement basic hardening of system.
- Construct command line syntax to explore the system and gather resource information.
- Construct scripting structures of assigning variables, conditional tests, and recording output to generate scripts that do basic system tasks.
- Analyze and troubleshoot the Apache Web Server
- Analyze and troubleshoot the NFS/Samba File Shares.
- Analyze Docker and Kubernetes components and workflows.
- Describe and troubleshoot network services.
- Write and perform Ansible tasks to automate deployments to servers.
Learning Materials and References
Required Resources
Cloud Lab server running Ubuntu on Killercoda.
- Minimal resources can accomplish our tasks
- 1 CPU
- 2 GB Ram
- 30 GB Hard Drive
- Network Interface (IP already setup)
Local VM server running: RHEL, Fedora, Rocky
- Minimal resources
- 1 CPU
- 2GB RAM
- 3 3-5GB Hard Drives
- Network Interface (Bridged)
ProLUG Lab access to Rocky 9.4+ instance.
- Minimal resources can accomplish our tasks
- 1 CPU
- 4 GB RAM
- 15 GB Hard Drive
- 3 x 3GB hard drives (for raid and disk labs)
- Network Interface (IP already setup)
Course Plan
Instructional Methods
This course is designed to promote learner-centered activities and support the development of fundamental Linux skills. The course utilizes individual and group learning activities, performance-driven assignments, problem-based cases, projects, and discussions. These methods focus on building engaging learning experiences conducive to development of critical knowledge and skills that can be effectively applied in professional contexts.
Class size
This class will effectively engage 40-60 learners.
Class Schedule
Class will meet over weekend (Brown bag) sessions. 1 time per week, for 16 weeks. There will be a total of 16 sessions.
| Session | Topic |
|---|---|
| 1 | Get Linux Lab Access - CLI Primer - vi/vim/nano basics |
| 2 | Essential Tools - Files, Redirects, and Permissions |
| 3 | Storage - Logical Volume Management and RAID |
| 4 | Operating Running Systems |
| 5 | Security - Manage users and groups |
| 6 | Security - Firewalld/UFW |
| 7 | Security - Patching the system/ Package Management - yum, dnf, rpm |
| 8 | Scripting - System checks |
| 9 | Docker - K3s Setup and basics |
| 10 | K3s advanced w/ microservices |
| 11 | Monitoring systems |
| 12 | Engineering - System baselining/benchmarking and testing |
| 13 | System Hardening |
| 14 | Ansible Automation |
| 15 | Engineering Troubleshooting |
| 16 | Incident Response - Actual incident callout and information gathering |
Suggested Learning Approach
In this course, you will be studying individually and within a group of your peers, primarily in a lab environment. As you work on the course deliverables, you are encouraged to share ideas with your peers and instructor, work collaboratively on projects and team assignments, raise critical questions, and provide constructive feedback.
Students aiming to complete the Linux Systems Administration course are expected to devise and complete a capstone project, to be turned in at the end of the course.
The instructions, expectations, and deliverables for the project are listed on this page.
Instructions
-
Select a topic to research about a project that you are going to build.
Topics:
- System Stability
- System Performance
- System Security
- System monitoring
- Kubernetes
- Programming/Automation
-
Plan the project
- Find documentation or similar projects and build off of what was done there.
-
Document
- First pass, what does it take to build this?
-
Diagram
- Draw the thing
-
Build
- Get screen shots
- Make a video?
- Basically prove you built it.
-
Finalize documentation
- Redline the documentation
-
Prepare to Present (overleaf.com is a great alternative to Powerpoint)
- Setup a 15-20 slide deck on what you did
- Project purpose
- Diagram
- Build Process
- What did you learn?
- How are you going to apply this?
- Setup a 15-20 slide deck on what you did
-
Do any of you want to present?
- Let me (Scott) know and we’ll get you a slot in the last few weeks.
Deliverables
-
Build Documentation for your project that works in either the ProLUG labs, or in the Killercoda environment.
-
A diagram of what you built. This should be both a physical and a logical representation of the system (if applicable).
-
Examples of the running system, screen shots, or other proof that you built it and show it in a running state.
-
A 15-20 slide presentation of the above material that you would present to a group (presenting to us is voluntary, but definitely possible.)
Each course run through the Professional Linux Users Group (ProLUG) allows you to earn a certification upon completion.
Certificates are awarded to those who complete the course within the timeframe that it is being run through the ProLUG Discord.
- To see when courses are running, join the ProLUG Discord server and check the Events section.
If you aim to earn the certification for completing this course, you must follow the guidelines set forth in this document.
There are four main components to earning the certification.
Worksheet Completion
Each unit has a corresponding worksheet.
On this worksheet are discussion questions, terms/definitions, optional "digging
deeper" sections, and reflection questions.
These worksheets must be filled out and kept until the end of the course.
Upon reaching the end, they are to be submitted to the instructor (Scott Champine).
Worksheet Submission Format
The format in which you submit these worksheets is up to you.
Some students prefer to keep them in a GitHub repository, others prefer to just keep them as files on their machines and submit via email.
Discussion Questions
Each unit's worksheet contains multiple discussion questions.
Each discussion question has its own thread in the ProLUG Discord server, in the
#course-discussion-posts forum channel.
To qualify for certification, you must:
- Post your answer to each discussion question in the correct thread.
- Respond to another student's answer in the same thread.
The goal of this is not to create busywork, but to spark discussions and see things from other points of view.
Lab Completion
Each unit has a lab that is to be completed.
The labs, like the worksheets, should be also completed and saved until the end of the course.
These labs should be submitted to the instructor along with the worksheets in the same format of your choice.
Final Project
Each ProLUG course has students complete a capstone project.
This is a requirement for earning a ProLUG course certification.
The project must meet the standards set forth in the Final Project Outline (or otherwise be approved by the instructor, Scott Champine).
In the Beginning
Founded approximately 15 years ago, the Professional Linux User Group (ProLUG) began as a vision of Het Tanis, known by his community alias 'Scott Champine.' Het identified the need for an informal yet structured space where Linux professionals could share knowledge, collaborate, and grow together. What started as local in-person meetups quickly gained traction, thanks to the increasing demand for open-source collaboration and the widespread adoption of Linux in both enterprises and personal projects.
Why ProLUG Started
ProLUG was born out of the recognition that Linux professionals often face challenges that are best solved through peer collaboration and hands-on experience. The community’s founding principles were rooted in creating an environment where newcomers could learn from experienced professionals, and seasoned users could gain exposure to advanced topics and emerging technologies. Its core mission was simple yet impactful: to provide continuous growth opportunities in Linux system administration, automation, and cloud technologies.
Some of the key motivations behind ProLUG's formation include:
- Peer Support: Helping members solve technical challenges through discussion and advice from experts.
- Knowledge Sharing: Encouraging open sharing of tips, tricks, configurations, and scripts related to Linux and open-source tools.
- Hands-on Learning: Providing access to practical labs, exercises, and real-world scenarios for hands-on training.
- Community Mentorship: Offering a space for members to mentor and be mentored by others in different stages of their careers.
- Certification Prep: Assisting members in preparing for recognized industry certifications.
The Expansion into an Online Community
While initially focused on local in-person meetings, ProLUG embraced online platforms to extend its reach globally. The switch to a virtual model enabled:
- Global Networking: Professionals and enthusiasts from around the world could now connect, learn, and collaborate without geographical limitations.
- 24/7 Discussion: Via platforms like Discord, members could share insights, discuss Linux problems, and exchange ideas anytime, anywhere.
- Greater Diversity: The online expansion diversified the member base, incorporating individuals from various industries and technical backgrounds, creating a rich environment for problem-solving.
Interactive Labs and Training Programs
One of ProLUG’s most successful expansions has been its focus on interactive, hands-on labs. To bridge the gap between theory and practice, Het Tanis launched a series of labs on platforms like Killercoda, covering a variety of topics including:
- Linux Essentials and System Administration
- Ansible Automation
- Kubernetes and Container Orchestration
- Security and Network Hardening
With over 50 interactive labs available and more being continuously developed, members benefit from practical scenarios that simulate real-world challenges. The labs cater to beginners, intermediates, and experts, ensuring everyone has something to gain.
Certification and Career Development
In 2024, ProLUG launched its first structured certification course: Enterprise Linux Administration. This program was designed to provide a comprehensive curriculum covering topics such as:
- Advanced Linux system configuration
- Enterprise networking and services
- Security management
- Scripting and automation
The first cohort of graduates successfully completed the program in January 2025, marking a major milestone in ProLUG’s commitment to professional development. Many graduates have reported success stories, such as landing new jobs, securing promotions, or gaining confidence in their Linux expertise.
What is a User Group?
A user group is a community of individuals who come together to share common interests, typically in a specific area of technology, such as Linux. These groups can be local or online and serve as platforms for:
- Collaboration: Members work together to troubleshoot, build projects, and share experiences.
- Networking: Opportunities to connect with professionals, mentors, and employers within the field.
- Learning: Workshops, presentations, and discussions that cover new and emerging technologies.
- Career Growth: Access to resources, training programs, and job opportunities.
ProLUG is a prime example of how a user group can grow beyond its initial purpose, evolving into a vibrant global community with practical learning opportunities and real-world outcomes.
Success Stories
Being part of ProLUG has proven highly beneficial for many members, with success stories ranging from career advancements to personal growth:
- Job Opportunities: Members have found jobs in system administration, DevOps, and cloud engineering roles through networking within ProLUG.
- Certifications: Many members have successfully obtained Linux-related certifications, including RHCSA, RHCE, and LFCS, using ProLUG’s resources and mentorship programs.
- Skill Development: Through interactive labs and group discussions, members have honed skills in automation (Ansible), scripting (Bash, Python), containerization (Docker, Kubernetes), and more.
- Mentorship Relationships: Senior professionals have mentored newcomers, creating a cycle of continuous learning and knowledge sharing.
Current Milestones
- 3,000+ Members: ProLUG’s global community continues to grow rapidly, attracting Linux enthusiasts and professionals from various backgrounds.
- 50+ Interactive Labs: Covering diverse topics, from basic Linux administration to advanced enterprise systems management.
- Ongoing Training Programs: Continuous updates to certification preparation courses, interactive workshops, and guided lab exercises.
ProLUG’s commitment to fostering a collaborative environment has made it a go-to community for anyone interested in Linux. Whether you're a beginner looking to learn the basics or an experienced professional aiming to advance your career, ProLUG offers a pathway to success.
Overview
This unit introduces the foundational skills needed for effective Linux system administration with an emphasis on Red Hat Enterprise Linux (RHEL). It covers:
-
Command-Line Proficiency: Mastery of the shell environment is essential for routine tasks such as navigating the file system, managing processes, and automating scripts.
-
Text Editing with VI/Vim: Given that many RHEL systems use VI/Vim as the default editor for configuration and scripting, learners are introduced to these tools through practical exercises like using vimtutor and exploring interactive resources (e.g., VIM Adventures).
-
Understanding the Linux File System: The worksheet emphasizes the standard Linux file hierarchy—critical for managing files, permissions, and services in a Red Hat environment.
-
Basic Utilities and System Management: Along with the command-line and text editors, the unit touches on fundamental utilities that are pivotal for system configuration, troubleshooting, and maintenance on enterprise systems.
Learning Objectives
- Master Command-Line Fundamentals:
- Develop proficiency in navigating the Linux command-line interface (CLI) for everyday system management tasks.
- Learn how to execute commands to manipulate files, directories, and system processes efficiently.
- Understand the Linux File System:
- Grasp the structure and organization of the Linux file hierarchy.
- Comprehend how the file system affects system configuration, security, and troubleshooting on Red Hat platforms.
- Gain Proficiency in Text Editing with VI/Vim:
- Acquire hands-on experience with vi/vim through guided exercises (e.g., vimtutor, VIM Adventures).
- Learn to edit configuration files and scripts accurately, which is critical for system administration.
- Engage with Practical System Administration Tasks:
- Explore foundational utilities and commands essential for managing a Linux system.
- Apply theoretical knowledge through real-world examples, discussion posts, and interactive resources to reinforce learning.
These objectives are designed to ensure that learners not only acquire technical competencies but also understand how these skills integrate into broader system administration practices in a Red Hat environment.
Relevance & Context
The skills taught in this unit are indispensable for several reasons:
-
Efficient System Management:
The RHEL environment is typically managed via the command line. Proficiency in the CLI, along with an in-depth understanding of the file system, is crucial for daily tasks like system configuration, package management (using tools such as YUM or DNF), and remote troubleshooting. -
Security and Stability:
Editing configuration files, managing system services, and monitoring logs are all critical tasks that ensure the secure and stable operation of RHEL systems. A robust understanding of these basics is necessary to mitigate risks and ensure compliance with enterprise security standards. -
Professional Certification & Career Growth:
For those pursuing certifications like the Red Hat Certified System Administrator (RHCSA) or Red Hat Certified Engineer (RHCE), these foundational skills are not only testable requirements but also a stepping stone for more advanced topics such as automation (using Ansible), container management (with Podman or OpenShift), and performance tuning. -
Operational Excellence:
In enterprise settings where uptime and rapid incident response are paramount, having a solid grasp of these fundamentals enables administrators to quickly diagnose issues, apply fixes, and optimize system performance—thereby directly impacting business continuity and service quality.
Prerequisites
The unit assumes a basic level of computer literacy, meaning the learner is comfortable with fundamental computer operations. However, before achieving that level, one must have digital literacy. This involves:
-
Familiarity with Computer Hardware:
Understanding what a computer is, how to power it on/off, and how to use basic peripherals (keyboard, mouse, monitor). This foundational comfort enables users to interact with a computer effectively. -
Basic Software Navigation:
Knowing how to use common applications like web browsers, file managers, or simple text editors. This prior exposure helps learners transition into more specialized areas (like command-line interfaces) without being overwhelmed. -
Understanding Core Concepts:
Grasping the basic idea of files, directories, and simple interactions with the operating system lays the groundwork for later learning. Without this, even basic computer literacy may be hard to achieve.
Key terms and Definitions
Linux Kernel
Command-Line Interface (CLI)
Shell
Terminal
Filesystem Hierarchy
Package Manager (e.g., YUM/DNF)
Text Editors (VI/Vim)
Sudo
File Permissions and Ownership
Processes and Daemons
System Logs
Networking Basics
Bash Scripting
Instructions
Fill out the worksheet as you progress through the lab and discussions. Hold your worksheets until the end to turn them in as a final submission packet.
Resources / Important Links
Downloads
The worksheet has been provided below. The document(s) can be transposed to
the desired format so long as the content is preserved. For example, the .txt
could be transposed to a .md file.
Unit 1 Recording
Discussion Post #1
Using a 0-10 system, rate yourself on how well you think you know each topic in the table below. (You do not have to post this rating).
| Skill | High (8-10) | Mid (4-7) | Low (0-3) | Total |
|---|---|---|---|---|
| Linux | ||||
| Storage | ||||
| Security | ||||
| Networking | ||||
| Git | ||||
| Automation | ||||
| Monitoring | ||||
| Database | ||||
| Cloud | ||||
| Kubernetes | ||||
| Total |
Next, answer these questions here:
-
What do you hope to learn in this course?
-
What type of career path are you shooting for?
Discussion Post #2
-
Post a job that you are interested in from a local job website. (link or image)
-
What do you know how to do in the posting?
-
What don't you know how to do in the posting?
-
What are you doing to close the gap? What can you do to remedy the difference?
The discussion posts are done in Discord threads. Click the 'Threads' icon on the top right and search for the discussion post.
Start thinking about your project ideas (more to come in future weeks):
Topics:
- System Stability
- System Performance
- System Security
- System monitoring
- Kubernetes
- Programming/Automation
You will research, design, deploy, and document a system that improves your administration of Linux systems in some way.
Definitions
Kernel:
Kernel Args:
OS Version:
Modules:
Mount Points:
Text Editor:
Digging Deeper
-
Use vimtutor and see how far you get. What did you learn that you did not know about vi/vim?
-
Go to https://vim-adventures.com/ and see how far you get. What did you learn that you did not already know about vi/vim?
-
Go to https://www.youtube.com/watch?v=d8XtNXutVto and see how far you get with vim. What did you learn that you did not already know about vi/vim?
Reflection Questions
-
What questions do you still have about this week?
-
How are you going to use what you’ve learned in your current role?
If you are unable to finish the lab in the ProLUG lab environment we ask you
rebootthe machine from the command line so that other students will have the intended environment.
Resources / Important Links
Required Materials
- Rocky 9.4+ - ProLUG Lab
- Or comparable Linux box
- root or sudo command access
Downloads
The lab has been provided for convenience below:
Pre-Lab Warm-Up
EXERCISES (Warmup to quickly run through your system and familiarize yourself)
mkdir lab_essentials
cd lab_essentials
ls
touch testfile1
ls
touch testfile{2..10}
ls

# What does this do differently?
# Can you figure out what the size of those files are in bytes? What command did you use?

touch file.`hostname`
touch file.`hostname`.`date +%F`
touch file.`hostname`.`date +%F`.`date +%s`
ls

# What do each of these values mean? `man date` to figure those values out.

# Try to set the following values in the file

# year, just two digits
# today's day of the month
# Just the century

date +%y
date +%e
date +%C
Lab 🧪
This lab is designed to help you get familiar with the basics of the systems you will be working on. Some of you will find that you know the basic material but the techniques here allow you to put it together in a more complex fashion.
It is recommended that you type these commands and do not copy and paste them. Word sometimes likes to format characters and they don’t always play nice with Linux.
Working with files:
# Creating empty files with touch
touch fruits.txt

ls -l fruits.txt
# You will see that fruits.txt exists and is a 0 length (bytes) file

-rw-r--r--. 1 root root 0 Jun 22 07:59 fruits.txt
# Take a look at those values and see if you can figure out what they mean.
# man touch and see if it has any other useful features you might use. If
# you’ve ever used tiered storage think about access times and how to keep data
# hot/warm/cold. If you haven’t just look around for a bit.

rm -rf fruits.txt

ls -l fruits.txt
# You will see that fruits.txt is gone.
Creating files just by stuffing data in them:
echo “grapes 5” > fruits.txt
cat fruits.txt
echo “apples 3” > fruits.txt
cat fruits.txt

echo “ “ > fruits.txt

echo “grapes 5” >> fruits.txt
cat fruits.txt
echo “apples 3” >> fruits.txt
cat fruits.txt
What is the difference between these two? Appending a file >> adds to the file whereas > just overwrites the file each write. Log files almost always are written with >>, we never > over those types of files.
Creating file with vi or vim:
# It is highly recommended the user read vimtutor. To get vimtutor follow
# these steps:
sudo -i
yum -y install vim
vimtutor

# There are about 36 short labs to show a user how to get around inside of vi.
# There are also cheat sheets around to help.

vi somefile.txt
# type “i” to enter insert mode

# Enter the following lines
grapes 5
apples 7
oranges 3
bananas 2
pears 6
pineapples 9

# hit the “esc” key at the top left of your keyboard
# Type “:wq”
# Hit enter

cat somefile.txt
Copying and moving files:
cp somefile.txt backupfile.txt
ls
cat backupfile.txt
mv somefile.txt fruits.txt
ls
cat fruits.txt
Look at what happened in each of these scenarios. Can you explain the difference between cp and mv? Read the manuals for cp and mv to see if there’s anything that may be useful to you. For most of us -r is tremendously useful option for moving directories.
Searching/filtering through files:
# So maybe we only want to see certain values from a file, we can filter
# with a tool called grep

cat fruits.txt
cat fruits.txt | grep apple
cat fruits.txt | grep APPLE

# read the manual for grep and see if you can cause it to ignore case.

# See if you can figure out how to both ignore case and only find the
# word apple at the beginning of the line.

# If you can’t, here’s the answer. Try it:
cat fruits.txt | grep -i "^apple"
Can you figure out why that worked? What do you think the ^ does? Anchoring is a common term for this. See if you can find what anchors to the end of a string.
Sorting files with sort:
# Let’s sort our file fruits.txt and look at what happens to the output
# and the original file

sort fruits.txt
cat fruits.txt

# Did the sort output come out different than the cat output? Did sorting
# your file do anything to your original data? So let’s sort our data again
# and figure out what this command does differently

sort -k 2 fruits.txt

# You can of course man sort to figure it out, but -k refers to the “key” and
# can be useful for sorting by a specific column

# But, if we cat fruits.txt we see we didn’t save anything we did. What if we
# wanted to save these outputs into a file. Could you do it? If you couldn’t,
# here’s an answer:

sort fruits.txt > sort_by_alphabetical.txt
sort -k 2 fruits.txt > sort_by_price.txt

# Cat both of those files out and verify their output
Advanced sort practice:
# Consider the command
ps -aux

# But that’s too long to probably see everything, so let’s use a command
# to filter just the top few lines
ps -aux | head

# So now you can see the actual fields (keys) across the top that we could sort by

USER PID %CPU %MEM VSZ RSS TTY STAT START TIME COMMAND

# So let’s say we wanted to sort by %MEM
ps -aux | sort -k 4 -n -r | head -10
Read man to see why that works. Why do you suppose that it needs to be reversed to have the highest numbers at the top? What is the difference, if you can see any, between using the -n or not using it? You may have to use head -40 to figure that out, depending on your processes running.
Read man ps to figure out what other things you can see or sort by from the ps command. We will examine that command in detail in another lab.
Working with redirection:
The good thing is that you’ve already been redirecting information into files. The > and >> are useful for moving data into files. We have other functionality within redirects that can prove useful for putting data where we want it, or even not seeing the data.
Catching the input of one command and feeding that into the input of another command We’ve actually been doing this the entire time. “|” is the pipe operator and causes the output of one command to become the input of the second command.
cat fruits.txt | grep apple
# This cats out the file, all of it, but then only shows the things that
# pass through the filter of grep. We could continually add to these and make
# them longer and longer

cat fruits.txt | grep apple | sort | nl | awk ‘{print $2}’ | sort -r
pineapples
apples
cat fruits.txt | grep apple | sort | nl | awk '{print $3}' | sort -r
9
7
cat fruits.txt | grep apple | sort | nl | awk '{print $1}' | sort -r
2
1

# Take these apart by pulling the end pipe and command off to see what is
# actually happening:

cat fruits.txt | grep apple | sort | nl | awk '{print $1}' | sort -r
2
1
cat fruits.txt | grep apple | sort | nl | awk '{print $1}'
1
2
cat fruits.txt | grep apple | sort | nl
1 apples 7
2 pineapples 9
cat fruits.txt | grep apple | sort
apples 7
pineapples 9
cat fruits.txt | grep apple
apples 7
pineapples 9
See if you can figure out what each of those commands do.
Read the manual man command for any command you don’t recognize.
Use something you learned to affect the output.
Throwing the output into a file:
We’ve already used > and >> to throw data into a file but when we redirect like that we are catching it before it comes to the screen. There is another tool that is useful for catching data and also showing it to us, that is tee.
date
# comes to the screen

date > datefile
# redirects and creates a file datefile with the value

date | tee -a datefile
# will come to screen, redirect to the file.
Do a quick man on tee to see what the -a does. Try it without that value. Can you see any other useful options in there for tee?
Ignoring pesky errors or tossing out unwanted output:
Sometimes we don’t care when something errs out. We just want to see that it’s working or not. If you’re wanting to filter out errors (2) in the standarderr, you can do this
ls fruits.txt
# You should see normal output

ls fruity.txt
# You should see an error unless you made this file

ls fruity.txt 2> /dev/null
# You should no longer see the error.

# But, sometimes you do care how well your script runs against 100 servers,
# or you’re testing and want to see those errors. You can redirect that to a file, just as easy

ls fruity.txt 2> error.log
cat error.log
# You’ll see the error. If you want it see it a few times do the error line to see it happen.
In one of our later labs we’re going to look at stressing our systems out. For this, we’ll use a command that basically just causes the system to burn cpu cycles creating random numbers, zipping up the output and then throwing it all away. Here’s a preview of that command so you can play with it.
May have to yum -y install bzip2 for this next one to work.
time dd if=/dev/urandom bs=1024k count=20 | bzip2 -9 >> /dev/null
Use “crtl + c” to break if you use that and it becomes too long or your system is under too much load. The only numbers you can play with there are the 1024k and the count. Other numbers should be only changed if you use man to read about them first.
This is the “poor man’s” answer file. Something we used to do when we needed to answer some values into a script or installer. This is still very accurate and still works, but might be a bit advanced with a lot of advanced topics in here. Try it if you’d like but don’t worry if you don’t get this on the first lab.
vi testscript.sh
hit “i” to enter insert mode
add the following lines:

#!/bin/bash

read value
echo "The first value is $value"
read value
echo "The second value is $value"
read value
echo "The third value is $value"
read value
echo "The fourth value is $value"

# hit “esc” key
type in :wq
# hit enter

chmod 755 testscript.sh

# Now type in this (don’t type in the > those will just be there in your shell):

[xgqa6cha@N01APL4244 ~]$ echo "yes

> no
> 10
> why" | ./testscript.sh
> yes
> no
> 10
> why
What happened here is that we read the input from command line and gave it, in order to the script to read and then output. This is something we do if we know an installer wants certain values throughout it, but we don’t want to sit there and type them in, or we’re doing it across 100 servers quickly, or all kinds of reasons. It’s just a quick and dirty input “hack” that counts as a redirect.
Working with permissions:
Permissions have to do with who can or cannot access (read), edit (write), or execute (xecute)files.
Permissions look like this.
ls -l
| Permission | # of Links | UID Owner | Group Owner | Size (b) | Creation Month | Creation Day | Creation Time | File Name |
|---|---|---|---|---|---|---|---|---|
| -rw-r--r--. | 1 | Root | root | 58 | Jun | 22 | 08:52 | datefile |
The primary permissions commands we’re going to use are going to be chmod (access) and chown (ownership).
A quick rundown of how permissions break out:
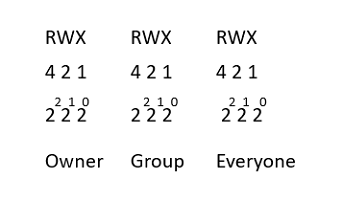
Let’s examine some permissions and see if we can’t figure out what permissions are allowed.
ls -ld /root/
# drwx------. 5 root root 4096 Jun 22 09:11 /root/
The first character lets you know if the file is a directory, file, or link. In this case we are looking at my home directory.
rwx: For UID (me).
- What permissions do I have?
---: For group.
- Who are they?
- What can my group do?
---: For everyone else.
- What can everyone else do?
Go find some other interesting files or directories and see what you see there. Can you identify their characteristics and permissions?
Be sure to
rebootthe lab machine from the command line when you are done.
NOTE: This is an optional bonus section. You do not need to read it, but if you're interested in digging deeper, this is for you.
Module 1: Getting Started (Days 1-2)
Day 1: First Contact with VIM
Segment 1: The Basics
- Complete first section of
vimtutor - Learn essential commands:
vim filename- Open/create filei- Enter insert mode (before the cursor)a- Enter insert mode (after the cursor)Esc- Return to normal mode:w- Save changes:q- Quit:wqorZZ- Save and quit:q!- Quit without saving
Segment 2: Building Muscle Memory
- Create five different files
- Practice mode switching 50 times
- Write and save content in each file
- Practice recovering from common mistakes:
- Accidentally pressed keys in normal mode
- Forgot to enter insert mode
- Trying to quit without saving
Segment 3: First Real Task
- Create a simple bash script template
- Add standard sections:
- Shebang line
- Comments
- Basic variables
- Simple functions
- Save and reopen multiple times
Day 2: Comfort Zone
Segment 1: More Basic Operations
- Complete second section of
vimtutor - Practice quick save and exit combinations
- Learn to read VIM messages and errors
- Understand modes in depth:
- Normal mode
- Insert mode
- Visual mode (introduction)
Segment 2: Error Recovery
- Create deliberate errors and fix them:
- Write without insert mode
- Exit without saving needed changes
- Get stuck in different modes
- Practice until you can recover without thinking
Segment 3: Real Config Practice
- Copy
/etc/hostsfile - Make various modifications:
- Add new host entries
- Modify existing entries
- Add comments
- Save different versions
Module 2: Navigation (Days 3-4)
Day 3: Basic Movement
Segment 1: Core Movement Commands
- Master the basics:
h- Leftj- Downk- Upl- Rightw- Next wordb- Previous word0- Line start$- Line end^- First non-blank character of the lineg_- Last non-blank character of the line
Segment 2: Movement Drills
- Create a "movement course" file
- Practice moving between marked points
- Time your navigation speed
- Compete against your previous times
Segment 3: Applied Navigation
- Navigate through
/etc/ssh/sshd_config:- Find specific settings
- Move between sections
- Locate comments
- Jump to line numbers
Day 4: Advanced Movement
Segment 1: Extended Movement
- Learn efficient jumps:
gg- File startG- File end{- Previous paragraph}- Next paragraphCtrl+f- Page downCtrl+b- Page up
Segment 2: Speed Training
- Work with a large configuration file
- Practice jumping between sections
- Find specific lines quickly
- Navigate through code blocks
Segment 3: Real-world Navigation
- Work with system logs
- Jump between error messages
- Navigate through long configuration files
- Practice quick file browsing
Module 3: Essential Editing (Days 5-7)
Day 5: Basic Editing
Segment 1: Edit Commands
- Master core editing:
x- Delete characterdd- Delete lineyy- Copy linep- Paste afterP- Paste beforeu- UndoCtrl + r- Redos- Substitute a characterr- Replace a characterc- Change character
Segment 2: Editing Drills
- Create practice documents
- Delete and replace text
- Copy and paste sections
- Practice undo/redo chains
Segment 3: System File Editing
- Work with
/etc/fstabcopy:- Add mount points
- Remove entries
- Comment lines
- Fix formatting
Day 6: Intermediate Editing
Segment 1: Combined Commands
- Learn efficient combinations:
dw- Delete wordd$- Delete to line endd0- Delete to line startcc- Change whole linecw- Change wordD- Delete to line endC- Change to line end
Segment 2: Practical Application
- Edit service configuration files
- Modify system settings
- Update network configurations
- Clean up log files
Segment 3: Speed Challenges
- Timed editing tasks
- Configuration file cleanup
- Quick text transformation
- Error correction sprints
Day 7: Editing Mastery
Segment 1: Advanced Operations
- Master text objects:
ciw- Change inner wordci"- Change inside quotesdi(- Delete inside parenthesesyi{- Yank inside bracesca"- Change a quotes blockda{- Delete a{}blockya(- Yank a()block
Segment 2: Integration Practice
- Combine all learned commands
- Work with multiple files
- Practice common scenarios
- Time your operations
Daily Success Metrics
By end of each day, you should be able to:
- Day 1: Open, edit, save, and exit files confidently
- Day 2: Understand and recover from common errors
- Day 3: Navigate small files without arrow keys
- Day 4: Move through large files efficiently
- Day 5: Perform basic edits without hesitation
- Day 6: Combine movement and editing commands
- Day 7: Edit configuration files with confidence
Practice Tips
- Use
vimtutorduring breaks - Disable arrow keys completely
- Keep a command log of new discoveries
- Time your editing operations
- Practice with real system files (copies)
Remember: Focus on accuracy first, then build speed.
Downloads
Overview
This unit centers on a focus on security and troubleshooting.
- The use of SELinux for implementing mandatory access controls, managing file permissions with ACLs (Access Control Lists),
- Understanding operational methodologies for incident triage.
Learning Objectives
-
Understand and Configure SELinux:
- Grasp the core concepts of SELinux, including security contexts, labels, and its role in enforcing mandatory access control.
- Learn how to configure and troubleshoot SELinux settings to ensure system security and compliance.
-
Master Access Control Lists (ACLs):
- Recognize the limitations of traditional Unix permissions and how ACLs provide granular control over file and directory access.
- Develop skills in applying and managing ACLs in a complex Linux environment.
-
Develop Effective Troubleshooting Methodologies:
- Acquire techniques to diagnose and resolve system access issues, particularly those arising from SELinux policies and ACL misconfigurations.
- Apply structured troubleshooting strategies to ensure minimal downtime and maintain high availability.
-
Integrate Theoretical Knowledge with Practical Application:
- Engage with interactive exercises, discussion prompts, and real-world scenarios to reinforce learning.
- Utilize external resources, such as technical documentation and instructional videos, to supplement hands-on practice.
-
Enhance Collaborative Problem-Solving Skills:
- Participate in peer discussions and reflective exercises to compare different approaches to system administration challenges.
- Learn to articulate and document troubleshooting processes and system configurations for continuous improvement.
-
Build a Foundation for Advanced Security Practices:
- Understand how SELinux and ACLs fit into the broader context of system security and operational stability.
- Prepare for more advanced topics by reinforcing the fundamental skills needed to manage and secure Red Hat Enterprise Linux environments.
These objectives aim to ensure that learners not only acquire specific technical skills but also develop a holistic understanding of how to secure and manage Linux systems in enterprise settings.
Relevance & Context
For Linux administrators and engineers, mastering SELinux and ACLs is essential because these tools add critical layers of security and control over system resources. By understanding how to use security contexts and labels, professionals can:
-
Enhance System Security: Implementing SELinux helps mitigate vulnerabilities by enforcing strict access controls.
-
Troubleshoot Access Issues: Knowledge of ACLs and SELinux enables the identification and resolution of permission-related issues, which are common in complex, multi-user environments.
-
Improve System Reliability: Understanding these concepts supports the broader goal of maintaining high availability and operational stability, especially when systems must operate under varying security configurations.
Prerequisites
Before engaging with this unit, readers should have a foundational understanding of:
-
Basic Linux Commands and File System Structure: Familiarity with navigating Linux directories, managing files, and using the terminal.
-
Traditional Unix Permissions: A solid grasp of the standard user/group/other permission model.
-
Fundamental Security Principles: An introductory knowledge of concepts like Discretionary Access Control (DAC) and Mandatory Access Control (MAC), which provide the groundwork for understanding SELinux.
-
Basic Troubleshooting Techniques: Experience with diagnosing and resolving common system issues will be beneficial when applying the methodologies discussed in the unit.
Key terms and Definitions
SELinux (Security-Enhanced Linux)
Access Control Lists (ACLs)
Security Contexts
Mandatory Access Control (MAC)
Discretionary Access Control (DAC)
Uptime
Standard Streams (stdin, stdout, stderr)
High Availability (HA)
Service Level Objectives (SLOs)
Troubleshooting Methodologies
Instructions
Fill out the worksheet as you progress through the lab and discussions. Hold your worksheets until the end to turn them in as a final submission packet.
Resources / Important Links
Downloads
The worksheet has been provided below. The document(s) can be transposed to
the desired format so long as the content is preserved. For example, the .txt
could be transposed to a .md file.
Unit 2 Recording
Unit 2 Discussion Post #1
Think about how week 1 went for you.
-
Do you understand everything that needs to be done?
-
Do you need to allocate more time to the course, and if so, how do you plan to do it?
-
How well did you take notes during the lecture? Do you need to improve this?
Unit 2 Discussion Post #2
Read a blog, check a search engine, or ask an AI about SELinux.
What is the significance of contexts? What are the significance of labels?
Scenario:
You follow your company instructions to add a new user to a set of 10 Linux servers. They cannot access just one of the servers.
When you review the differences in the servers you see that the server they cannot access is running SELINUX. On checking other users have no problem getting into the system.
You find nothing in the documentation (typical) about this different system or how these users are accessing it.
What do you do?
Where do you check?
You may use any online resources to help you answer this. This is not a trick and it is not a “one answer solution”. This is for you to think through.
The discussion posts are done in Discord threads. Click the 'Threads' icon on the top right and search for the discussion post.
Start thinking about your project ideas (more to come in future weeks):
Topics:
- System Stability
- System Performance
- System Security
- System monitoring
- Kubernetes
- Programming/Automation
You will research, design, deploy, and document a system that improves your administration of Linux systems in some way.
Definitions
Uptime:
Standard input (stdin):
Standard output (stdout):
Standard error (stderr):
Mandatory Access Control (MAC):
Discretionary Access Control (DAC):
Security contexts (SELinux):
SELinux operating modes:
Digging Deeper
-
How does troubleshooting differ between system administration and system engineering? To clarify, how might you troubleshoot differently if you know a system was previously running correctly. If you’re building a new system out?
-
Investigate a troubleshooting methodology, by either Google or AI search. Does the methodology fit for you in an IT sense, why or why not?
Reflection Questions
-
What questions do you still have about this week?
-
How are you going to use what you’ve learned in your current role?
If you are unable to finish the lab in the ProLUG lab environment we ask you
rebootthe machine from the command line so that other students will have the intended environment.
Resources / Important Links
Required Materials
- Putty or other connection tool
- Rocky 9.4+ - ProLUG Lab
- Or comparable Linux box
- root or sudo command access
Downloads
The lab has been provided for convenience below:
Pre-Lab Warm-Up
EXERCISES (Warmup to quickly run through your system and familiarize yourself)
cd ~
ls
mkdir evaluation
mkdir evaluation/test/round6
# This fails, can you find out why?

mkdir -p evaluation/test/round6
# This works, think about why?

cd evaluation
pwd
# What is the path you are in?

touch testfile1
ls
# What did this do?

touch testfile{2..10}
ls
# What did this do differently than earlier?
# touch .hfile .hfile2 .hfile3

ls
# Can you see your newest files? Why or why not? (man ls)
# What was the command to let you see those hidden files?

ls -l
# What do you know about this long listing? Think about 10 things this can show you.
# Did it show you all the files or are some missing?
Lab 🧪
This lab is designed to help you get familiar with the basics of the systems you will be working on. Some of you will find that you know the basic material but the techniques here allow you to put it together in a more complex fashion.
It is recommended that you type these commands and do not copy and paste them. Word sometimes likes to format characters and they don’t always play nice with Linux.
Gathering system information:
hostname
cat /etc/*release
# What do you recognize about this output? What version of RHEL (CENTOS) are we on?

uname
uname -a
uname -r

# man uname to see what those options mean if you don’t recognize the values
Check the amount of RAM:
cat /proc/meminfo
free
free -m

# What do each of these commands show you? How are they useful?
Check the number of processors and processor info:
cat /proc/cpuinfo
# What type of processors do you have? How many are there? (counting starts at 0)

cat /proc/cpuinfo | grep proc | wc -l
# Does this command accurately count the processors?
Check Storage usage and mounted filesystems:
df
# But df is barely readable, so find the option that makes it more readable `man df`

df -h
df -h | grep -i var
# What does this show, or search for? Can you invert this search? (hint `man grep`
# look for invert or google “inverting grep’s output”)

df -h | grep -i sd
# This one is a little harder, what does this one show? Not just the line, what are
# we checking for? (hint if you need it, google “what is /dev/sda in linux”)

mount
# Mount by itself gives a huge amount of information. But, let’s say someone is asking
# you to verify that the mount is there for /home on a system. Can you check that
# quickly with one command?

mount | grep -i home
#This works, but there is a slight note to add here. Just because something isn’t
# individually mounted doesn’t mean it doesn’t exist. It just means it’s not part of
# it’s own mounted filesystem.

mount | grep -i /home/xgqa6cha
# will produce no output

df -h /home/xgqa6cha
# will show you that my home filesystem falls under /home.

cd ~; pwd; df -h .
# This command moves you to your home directory, prints out that directory,
# and then shows you what partition your home directory is on.

du -sh .
# will show you space usage of just your directory

try `du -h .` as well to see how that ouput differs
# read `man du` to learn more about your options.
Check the system uptime:
uptime

man uptime
# Read the man for uptime and figure out what those 3 numbers represent.
# Referencing this server, do you think it is under high load? Why or why not?
Check who has recently logged into the server and who is currently in:
last
# Last is a command that outputs backwards. (Top of the output is most recent).
# So it is less than useful without using the more command.

last | more
# Were you the last person to log in? Who else has logged in today?

w
who
whoami
# how many other users are on this system? What does the pts/0 mean on google?
Check who you are and what is going on in your environment:
printenv
# This scrolls by way too fast, how would you search for your home?

printenv | grep -i home
whoami
id
echo $SHELL
Check running processes and services:
ps -aux | more
ps -ef | more
ps -ef | wc -l
Check memory usage and what is using the memory:
# Run each of these individually for understanding before we look at part b.
free -m
free -m | egrep “Mem|Swap”
free -m| egrep “Mem|Swap” | awk ‘{print $1, $2, $3}’
free -t | egrep "Mem|Swap" | awk '{print $1 " Used Space = " ($3 / $2) * 100"%"}'

# Taking this apart a bit:
# You’re just using free and searching for the lines that are for memory and swap
# You then print out the values $1 = Mem or Swap
# You then take $3 used divided by $2 total and multiply by 100 to get the percentage
Have you ever written a basic check script or touched on conditional statements or loops? (Use ctrl + c to break out of these):
while true; do free -m; sleep 3; done

# Watch this output for a few and then break with ctrl + c
# Try to edit this to wait for 5 seconds
# Try to add a check for uptime and date each loop with a blank line between
# each and 10 second wait:

while true; do date; uptime; free -m; echo “ “; sleep 10; done
# Since we can wrap anything inside of our while statements, let’s try adding
# something from earlier:
while true; do free -t | egrep "Mem|Swap" | awk '{print $1 " Used Space = " ($3 / $2) * 100"%"}'; sleep 3; done
seq 1 10
# What did this do?
# Can you man seq to modify that to count from 2 to 20 by 2’s?
# Let’s make a counting for loop from that sequence

for i in `seq 1 20`; do echo "I am counting i and am on $i times through the loop"; done
Can you tell me what is the difference or significance of the $ in the command above? What does that denote to the system?
Be sure to
rebootthe lab machine from the command line when you are done.
Overview
The unit focuses on understanding and implementing techniques to ensure systems remain operational with minimal downtime.
-
The process of quickly assessing, prioritizing, and addressing system incidents.
-
Leveraging performance indicators (KPIs, SLIs) and setting clear operational targets (SLOs, SLAs) to guide troubleshooting and recovery efforts.
Learning Objectives
-
Understand Fundamental Concepts of System Reliability and High Availability:
-
Explain the importance of uptime and the implications of “Five 9’s” availability in mission-critical environments.
-
Define key terms such as Single Point of Failure (SPOF), Mean Time to Detect (MTTD), Mean Time to Recover (MTTR), and Mean Time Between Failures (MTBF).
-
-
Identify and Apply High Availability Architectures:
-
Differentiate between Active-Active and Active-Standby configurations and describe their advantages and trade-offs.
-
Evaluate real-world scenarios to determine where redundancy and clustering (using tools like Pacemaker and Corosync) can improve system resilience.
-
-
Develop Incident Triage and Response Skills:
-
Outline a structured approach to incident detection, prioritization, and resolution.
-
Use performance metrics (KPIs, SLIs, SLOs, and SLAs) to guide decision-making during operational incidents.
-
-
Integrate Theoretical Knowledge with Practical Application:
-
Leverage external resources (such as AWS whitepapers, Google SRE documentation, and Red Hat guidelines) to deepen understanding of system reliability best practices.
-
Participate in interactive discussion posts and collaborative problem-solving exercises to reinforce learning.
-
-
Cultivate Analytical and Troubleshooting Abilities:
-
Apply systematic troubleshooting techniques to diagnose and resolve system issues.
-
Reflect on incident case studies and simulated exercises to improve proactive prevention strategies.
-
These learning objectives are designed to ensure that participants not only grasp the theoretical underpinnings of system reliability and high availability but also build the practical skills needed for effective incident management and system optimization in a professional Linux environment.
Relevance & Context
-
Ensuring Mission-Critical Uptime: Minimizing downtime is critical, and high availability strategies help ensure continuous service—even in the face of hardware or software failures.
-
Optimized Incident Management: A well-practiced incident triage process enables administrators to quickly diagnose issues, reduce system downtime, and mitigate potential service interruptions.
-
Designing Resilient Architectures: For a Red Hat Systems Administrator, understanding how to build redundancy (using techniques like Active-Active or Active-Standby clustering) and eliminate Single Points of Failure (SPOFs) is key to creating robust systems.
-
Data-Driven Decision Making: Leveraging metrics such as KPIs, SLIs, SLOs, and SLAs allows administrators to set measurable goals, monitor performance, and make informed decisions about system improvements.
-
Integration with Enterprise Tools:
Red Hat environments often utilize specific tools (such as Pacemaker and Corosync for clustering, and Ansible for configuration management) that align with the concepts taught in this unit. Mastery of these principles helps engineers integrate and optimize these tools effectively within their infrastructure.
Prerequisites
Before engaging with this unit, readers should have a foundational understanding of:
-
Basic Networking Concepts: Familiarity with the principles of networking (such as IP addressing, DNS, and basic network troubleshooting) is crucial because many Linux administration tasks involve network configuration and monitoring.
-
Text Editing and Scripting Basics: An introductory exposure to editing text (using simple editors) and the idea of writing or running small scripts helps prepare learners for more complex shell operations.
-
Version Control (Git): Since the learning material and collaborative discussions use GitHub, understanding Git and markdown is beneficial.
-
Problem-Solving: A general troubleshooting mindset, including the ability to search documentation, diagnose issues systematically, and apply corrective measures.
Key terms and Definitions
Resilience Engineering
Fault Tolerance
Proactive Monitoring
Observability
Incident Response
Root Cause Analysis (RCA)
Disaster Recovery (DR)
Error Budgeting
Capacity Planning
Load Balancing Service Continuity
Infrastructure as Code (IaC)
Configuration Management
Preventive Maintenance
DevOps Culture
Instructions
Fill out the worksheet as you progress through the lab and discussions. Hold your worksheets until the end to turn them in as a final submission packet.
Resources / Important Links
- Google SRE Book - Implementing SLOs
- AWS High Availability Architecture Guide
- Red Hat High Availability Cluster Configuration
Downloads
The worksheet has been provided below. The document can be transposed to
the desired format so long as the content is preserved. For example, the .txt
could be transposed to a .md file.
Unit 3 Recording
Discussion Post #1
Scan the chapter here for keywords and pull out what you think will help you to better understand how to triage an incident.
Read the section called "Operation Security" in this same chapter: Building Secure and Reliable Systems
- What important concepts do you learn about how we behave during an operational response to an incident?
Discussion Post #2
Ask Google, find a blog, or ask an AI about high availability. (Here's one if you need it: AWS Real-Time Communication Whitepaper
- What are some important terms you read about? Why do you think understanding HA will help you better in the context of triaging incidents?
The discussion posts are done in Discord threads. Click the 'Threads' icon on the top right and search for the discussion post.
Definitions
Five 9's:
Single Point of Failure (SPOF):
Key Performance Indicators (KPIs):
Service Level Indicator (SLI):
Service Level Objective (SLO):
Service Level Agreement (SLA):
Active-Standby:
Active-Active:
Mean Time to Detect (MTTD):
Mean Time to Recover/Restore (MTTR):
Mean Time Between Failures (MTBF):
Digging Deeper
-
If uptime is so important to us, why is it so important to us to also understand how our systems can fail? Why would we focus on the thing that does not drive uptime?
-
Start reading about SLOs: Implementing SLOs How does this help you operationally? Does it make sense that keeping systems within defined parameters will help keep them operating longer?
Reflection Questions
-
What questions do you still have about this week?
-
How are you going to use what you've learned in your current role?
If you are unable to finish the lab in the ProLUG lab environment we ask you
rebootthe machine from the command line so that other students will have the intended environment.
Resources / Important Links
Required Materials
- Rocky 9.4+ - ProLUG Lab
- Or comparable Linux box
- root or sudo command access
Downloads
The lab has been provided for convenience below:
Pre-Lab Warm-Up
EXERCISES (Warmup to quickly run through your system and familiarize yourself)
cd ~
mkdir lvm_lab

cd lvm_lab
touch somefile
echo “this is a string of text” > somefile
cat somefile
echo “this is a string of text” > somefile
# Repeat 3 times

cat somefile
# How many lines are there?

Echo “this is a string of text” >> somefile
# Repeat 3 times

cat somefile
# How many lines are there?

# cheat with `cat somefile | wc -l`
echo “this is our other test text” >> somefile
# Repeat 3 times

cat somefile | nl
# How many lines are there?

cat somefile | nl | grep test
# compare that with 14

cat somefile | grep test | nl
If you want to preserve positional lines in file (know how much you’ve cut out when you grep something, or generally be able to find it in the unfiltered file for context, always | nl | before your grep
Pre Lab - Disk Speed tests:
When using the ProLUG lab environment, you should always check that there
are no other users on the system w or who.
After this, you may want to check the current state of the disks, as they retain
their information even after a reboot resets the rest of the machine. lsblk /dev/xvda.
# If you need to wipe the disks, you should use fdisk or a similar partition utility.
fdisk /dev/xvda

p #print to see partitions
d #delete partitions or information
w #Write out the changes to the disk.
This is an aside, before the lab. This is a way to test different read or writes into or out of your filesystems as you create them. Different types of raid and different disk setups will give different speed of read and write. This is a simple way to test them. Use these throughout the lab in each mount for fun and understanding.
Write tests (saving off write data - rename /tmp/file each time):
# Check /dev/xvda for a filesystem
blkid /dev/xvda

# If it does not have one, make one
mkfs.ext4 /dev/xvda
mkdir /space # (If you don’t have it. Lab will tell you to later as well)

mount /dev/xvda /space
Write Test:
for i in `seq 1 10`; do time dd if=/dev/zero of=/space/testfile$i bs=1024k count=1000 | tee -a /tmp/speedtest1.basiclvm; done
Read tests:
for i in `seq 1 10`; do time dd if=/space/testfile$i of=/dev/null; done
Cleanup:
for i in `seq 1 10`; do rm -rf /space/testfile$i; done
If you are re-creating a test without blowing away the filesystem, change the name or counting numbers of testfile because that’s the only way to be sure there is not some type of filesystem caching going on to optimize. This is especially true in SAN write tests.
Lab 🧪
start in root (#); cd /root
LVM explanation and use within the system:
# Check physical volumes on your server (my output may vary)
fdisk -l | grep -i xvd

# Disk /dev/xvda: 15 GiB, 16106127360 bytes, 31457280 sectors
# Disk /dev/xvdb: 3 GiB, 3221225472 bytes, 6291456 sectors
# Disk /dev/xvdc: 3 GiB, 3221225472 bytes, 6291456 sectors
# Disk /dev/xvde: 3 GiB, 3221225472 bytes, 6291456 sectors
Looking at Logical Volume Management:
Logical Volume Management is an abstraction layer that looks a lot like how we carve up SAN disks for storage management. We have Physical Volumes that get grouped up into Volume Groups. We carve Volume Groups up to be presented as Logical Volumes.
Here at the Logical Volume layer we can assign RAID functionality from our Physical Volumes attached to a Volume Group or do all kinds of different things that are “under the hood”. Logical Volumes get filesystems formatting and are mounted to the OS.
There are many important commands for showing your physical volumes, volume groups, and logical volumes.
The three simplest and easiest are:
pvs
vgs
lvs
With these you can see basic information that allows you to see how the disks are allocated. Why do you think there is no output from these commands the first time you run them? Try these next commands to see if you can figure out what is happening? To see more in depth information try pvdisplay, vgdisplay, and lvdisplay.
If there is still no output, it’s because this system is not configured for LVM. You will notice that none of the disk you verified are attached are allocated to LVM yet. We’ll do that next.
Creating and Carving up your LVM resources:
Disks for this lab are /dev/xvdb, /dev/xvdc, and /dev/xvdd. (but verify before continuing and adjust accordingly.)
We can do individual pvcreates for each disk pvcreate /dev/xvdb but we can also
loop over them with a simple loop as below. Use your drive letters.
for disk in b c d; do pvcreate /dev/xvd$disk; done

# Physical volume "/dev/xvdb" successfully created.
# Creating devices file /etc/lvm/devices/system.devices
# Physical volume "/dev/xvdc" successfully created.
# Physical volume "/dev/xvde" successfully created.

# To see what we made:

pvs

# PV VG Fmt Attr PSize PFree
# /dev/xvdb lvm2 --- 3.00g 3.00g
# /dev/xvdc lvm2 --- 3.00g 3.00g
# /dev/xvde lvm2 --- 3.00g 3.00g

vgcreate VolGroupTest /dev/xvdb /dev/xvdc /dev/xvde

# Volume group "VolGroupTest" successfully created

vgs
# VG #PV #LV #SN Attr VSize VFree
# VolGroupTest 3 0 0 wz--n- <8.99g <8.99g

lvcreate -l +100%FREE -n lv_test VolGroupTest

# Logical volume "lv_test" created.

lvs

# LV VG Attr LSize Pool Origin Data% Meta% Move Log Cpy%Sync Convert
# lv_test VolGroupTest -wi-a----- <8.99g
# Formatting and mounting the filesystem

mkfs.ext4 /dev/mapper/VolGroupTest-lv_test

# mke2fs 1.42.9 (28-Dec-2013)
# Filesystem label=
# OS type: Linux
# Block size=4096 (log=2)
# Fragment size=4096 (log=2)
# Stride=0 blocks, Stripe width=0 blocks
# 983040 inodes, 3929088 blocks
# 196454 blocks (5.00%) reserved for the super user
# First data block=0
# Maximum filesystem blocks=2151677952
# 120 block groups
# 32768 blocks per group, 32768 fragments per group
# 8192 inodes per group
# Superblock backups stored on blocks:
# 32768, 98304, 163840, 229376, 294912, 819200, 884736, 1605632, 2654208
#
# Allocating group tables: done
# Writing inode tables: done
# Creating journal (32768 blocks): done
# Writing superblocks and filesystem accounting information: done

mkdir /space #Created earlier
vi /etc/fstab

# Add the following line
# /dev/mapper/VolGroupTest-lv_test /space ext4 defaults 0 0

# reload fstab
systemctl daemon-reload
If this command works, there will be no output. We use the df -h in the next command to verify the new filesystem exists. The use of mount -a and not manually mounting the filesystem from the command line is an old administration trick I picked up over the years.
By setting our mount in /etc/fstab and then telling the system to mount everything we verify that this will come back up properly during a reboot. We have mounted and verified we have a persistent mount in one step.
df -h

# Filesystem Size Used Avail Use% Mounted on
# devtmpfs 4.0M 0 4.0M 0% /dev
# tmpfs 2.0G 0 2.0G 0% /dev/shm
# tmpfs 2.0G 8.5M 1.9G 1% /run
# tmpfs 2.0G 1.4G 557M 72% /
# tmpfs 2.0G 0 2.0G 0% /run/shm
# 192.168.200.25:/home 44G 15G 30G 34% /home
# 192.168.200.25:/opt 44G 15G 30G 34% /opt
# tmpfs 390M 0 390M 0% /run/user/0
# /dev/mapper/VolGroupTest-lv*test 8.8G 24K 8.3G 1% /space
Good place to speed test and save off your data.
Removing and breaking down the LVM to raw disks:
The following command is one way to comment out the line in /etc/fstab. If you had to do this across multiple servers this could be useful. (Or you can just use vi for simplicity).
grep lv_test /etc/fstab; perl -pi -e "s/\/dev\/mapper\/VolGroupTest/#removed \/dev\/mapper\/VolGroupTest/" /etc/fstab; grep removed /etc/fstab
# /dev/mapper/VolGroupTest-lv_test /space ext4 defaults 0 0
#removed dev/mapper/VolGroupTest-lv_test /space ext4 defaults 0 0

umount /space
lvremove /dev/mapper/VolGroupTest-lv_test

# Do you really want to remove active logical volume VolGroupTest/lv_test? [y/n]: y
# Logical volume "lv_test" successfully removed

vgremove VolGroupTest

# Volume group "VolGroupTest" successfully removed


for disk in c e f; do pvremove /dev/sd$disk; done

# Labels on physical volume "/dev/sdc" successfully wiped.
# Labels on physical volume "/dev/sde" successfully wiped.
# Labels on physical volume "/dev/sdf" successfully wiped.
Use your pvs;vgs;lvs commands to verify those volumes no longer exist.
pvs;vgs;lvs

# PV VG Fmt Attr PSize PFree
# /dev/sda2 VolGroup00 lvm2 a-- 17.48g 4.00m
# /dev/sdb VolGroup01 lvm2 a-- 20.00g 96.00m
# VG #PV #LV #SN Attr VSize VFree
# VolGroup00 1 9 0 wz--n- 17.48g 4.00m
# VolGroup01 1 1 0 wz--n- 20.00g 96.00m
# LV VG Attr LSize Pool Origin Data% Meta% Move Log
# LogVol00 VolGroup00 -wi-ao---- 2.50g
# LogVol01 VolGroup00 -wi-ao---- 1000.00m
# LogVol02 VolGroup00 -wi-ao---- 5.00g
# LogVol03 VolGroup00 -wi-ao---- 1.00g
# LogVol04 VolGroup00 -wi-ao---- 5.00g
# LogVol05 VolGroup00 -wi-ao---- 1.00g
# LogVol06 VolGroup00 -wi-ao---- 1.00g
# LogVol07 VolGroup00 -wi-ao---- 512.00m
# LogVol08 VolGroup00 -wi-ao---- 512.00m
# lv_app VolGroup01 -wi-ao---- 19.90g
More complex types of LVM:
LVM can also be used to raid disks
Create a RAID 5 filesystem and mount it to the OS (For brevity’s sake we will be limiting show commands from here on out, please use pvs,vgs,lvs often for your own understanding)
for disk in c e f; do pvcreate /dev/sd$disk; done

# Physical volume "/dev/sdc" successfully created.
# Physical volume "/dev/sde" successfully created.
# Physical volume "/dev/sdf" successfully created.

vgcreate VolGroupTest /dev/sdc /dev/sde /dev/sdf

lvcreate -l +100%FREE --type raid5 -n lv_test VolGroupTest
mkfs.xfs /dev/mapper/VolGroupTest-lv_test

vi /etc/fstab

# fix the /space directory to have these parameters (change ext4 to xfs)
/dev/mapper/VolGroupTest-lv_test /space xfs defaults 0 0

df -h
# Filesystem Size Used Avail Use% Mounted on
# /dev/mapper/VolGroup00-LogVol08 488M 34M 419M 8% /var/log/audit
# /dev/mapper/VolGroupTest-lv_test 10G 33M 10G 1% /space
Since we’re now using RAID 5 we would expect to see the size no longer match the full 15GB, 10GB is much more of a RAID 5 value 66% of raw disk space.
To verify our raid levels we use lvs
lvs
# LV VG Attr LSize Pool Origin Data% Meta% Move Log Cpy%Sync
# LogVol00 VolGroup00 -wi-ao---- 2.50g
# LogVol01 VolGroup00 -wi-ao---- 1000.00m
# LogVol02 VolGroup00 -wi-ao---- 5.00g
# LogVol03 VolGroup00 -wi-ao---- 1.00g
# LogVol04 VolGroup00 -wi-ao---- 5.00g
# LogVol05 VolGroup00 -wi-ao---- 1.00g
# LogVol06 VolGroup00 -wi-ao---- 1.00g
# LogVol07 VolGroup00 -wi-ao---- 512.00m
# LogVol08 VolGroup00 -wi-ao---- 512.00m
# lv*app VolGroup01 -wi-ao---- 19.90g
# lv_test VolGroupTest rwi-aor--- 9.98g 100.00
Spend 5 min reading the man lvs page to read up on raid levels and what they can accomplish.
To run RAID 5 3 disks are needed. To run RAID 6 at least 4 disks are needed.
Good place to speed test and save off your data
Set the system back to raw disks:
Unmount /space and remove entry from /etc/fstab
lvremove /dev/mapper/VolGroupTest-lv_test
# Do you really want to remove active logical volume VolGroupTest/lv_test? [y/n]: y
# Logical volume "lv_test" successfully removed

vgremove VolGroupTest
# Volume group "VolGroupTest" successfully removed

for disk in c e f; do pvremove /dev/sd$disk; done
# Labels on physical volume "/dev/sdc" successfully wiped.
# Labels on physical volume "/dev/sde" successfully wiped.
# Labels on physical volume "/dev/sdf" successfully wiped.
Working with MDADM as another RAID option:
There could be a reason to use MDADM on the system. For example you want raid handled outside of your LVM so that you can bring in sets of new disks already raided and treat them as their own Physical Volumes. Think, “I want to add another layer of abstraction so that even my LVM is unaware of the RAID levels.” This has special use case, but is still useful to understand.
May have to install mdadm yum: yum install mdadm
Create a raid5 with MDADM:
mdadm --create -l raid5 /dev/md0 -n 3 /dev/sdc /dev/sde /dev/sdf

# mdadm: Defaulting to version 1.2 metadata
# mdadm: array /dev/md0 started.
Add newly created /dev/md0 raid to LVM:
This is same as any other add. The only difference here is that LVM is unaware of the lower level RAID that is happening.
pvcreate /dev/md0
# Physical volume "/dev/md0" successfully created.

vgcreate VolGroupTest /dev/md0
# Volume group "VolGroupTest" successfully created

lvcreate -l +100%Free -n lv_test VolGroupTest
# Logical volume "lv_test" created.

lvs
# LV VG Attr LSize Pool Origin Data% Meta% Move Log
# LogVol00 VolGroup00 -wi-ao---- 2.50g
# LogVol01 VolGroup00 -wi-ao---- 1000.00m
# LogVol02 VolGroup00 -wi-ao---- 5.00g
# LogVol03 VolGroup00 -wi-ao---- 1.00g
# LogVol04 VolGroup00 -wi-ao---- 5.00g
# LogVol05 VolGroup00 -wi-ao---- 1.00g
# LogVol06 VolGroup00 -wi-ao---- 1.00g
# LogVol07 VolGroup00 -wi-ao---- 512.00m
# LogVol08 VolGroup00 -wi-ao---- 512.00m
# lv_app VolGroup01 -wi-ao---- 19.90g
# lv_test VolGroupTest -wi-a----- 9.99g
Note that LVM does not see that it is dealing with a raid system, but the size is still 10g instead of 15g.
Fix your /etc/fstab to read
/dev/mapper/VolGroupTest-lv_test /space xfs defaults 0 0
mkfs.xfs /dev/mapper/VolGroupTest-lv_test

# meta-data=/dev/mapper/VolGroupTest-lv_test isize=512 agcount=16, agsize=163712 blks
# = sectsz=512 attr=2, projid32bit=1
# = crc=1 finobt=0, sparse=0
# data = bsize=4096 blocks=2618368, imaxpct=25
# = sunit=128 swidth=256 blks
# naming =version 2 bsize=4096 ascii-ci=0 ftype=1
# log =internal log bsize=4096 blocks=2560, version=2
# = sectsz=512 sunit=8 blks, lazy-count=1
# realtime =none extsz=4096 blocks=0, rtextents=0

mount -a
Good place to speed test and save off your data
Setting the MDADM to persist through reboots:
(not in our lab environment though)
mdadm --detail --scan >> /etc/mdadm.conf
cat /etc/mdadm.conf
# ARRAY /dev/md0 metadata=1.2 name=ROCKY1:0 UUID=03583924:533e5338:8d363715:09a8b834
Verify with df -h ensure that your /space is mounted.
There is no procedure in this lab for breaking down this MDADM RAID.
You are root/administrator on your machine, and you do not care about the data on this RAID. Can you use the internet/man pages/or other documentation to take this raid down safely and clear those disks?
Can you document your steps so that you or others could come back and do this process again?
Be sure to
rebootthe lab machine from the command line when you are done.
NOTE: This is an optional bonus section. You do not need to read it, but if you're interested in digging deeper, this is for you.
When storage issues arise, troubleshooting step by step ensures a quick resolution. This guide flows logically, covering the most common issues you might face, from slow performance to filesystem corruption.
🔍 Step 1: Is Storage Performance Slow?
If everything feels sluggish, your disk might be the bottleneck.
Check:
# Monitor disk I/O, latency, and throughput
iostat -xz 1

# Identify processes consuming high I/O
pidstat -d 1

# Real-time disk activity monitoring
iostat -dx 1
- If I/O wait is high, it means the CPU is waiting on slow disk operations.
- If certain processes are consuming all disk bandwidth, they might be the cause.
Fix:
-
Identify and stop unnecessary high I/O processes:
# Forcefully terminate a process (use with caution) kill -9 <PID> -
Optimize filesystem writes (for ext4):
# Enable writeback mode for better performance tune2fs -o journal_data_writeback /dev/sdX -
Reduce excessive metadata writes:
# Disable access time updates and set commit interval mount -o noatime,commit=60 /mnt/data -
If using LVM, extend the volume to reduce fragmentation:
# Add 5GB to volume
lvextend -L +5G /dev/examplegroup/lv_data
🔍 Step 2: Is the Filesystem Full? ("No Space Left on Device")
👉 Disk space exhaustion is one of the most common causes of storage failures.
Check:
# Show disk usage per filesystem
df -hT

# Find the biggest files
du -ahx / | sort -rh | head -20
- If a filesystem is 100% full, it prevents writes and can cause application crashes.
- If there's space but files still won't write, check Step 4 (Corrupted Filesystem).
Fix:
-
Find and remove large unnecessary files:
# Remove specific log file rm -f /var/log/large_old_log.log -
Truncate logs safely without deleting them:
# Clear log contents while preserving file truncate -s 0 /var/log/syslog # Limit journal size journalctl --vacuum-size=100M -
Expand disk space if using LVM:
# Extend logical volume
lvextend -L +10G /dev/examplegroup/lv_data

# Resize filesystem
resize2fs /dev/examplegroup/lv_data  # for ext4
xfs_growfs /mnt/data                 # for XFS
🔍 Step 3: Are Mounts Failing? (LVM, fstab, NFS, SMB)
If files suddenly disappear or applications complain about missing storage, a mount issue may be the cause.
Check:
# View current mounts
mount | grep /mnt/data

# Check block devices
lsblk

# Verify permanent mount configuration
cat /etc/fstab
Fix:
-
Manually remount the filesystem (if missing):
# Remount all fstab entries mount -a -
Ensure correct fstab entry for persistence:
# Add to /etc/fstab (replace UUID with actual value) UUID=xxx-yyy-zzz /mnt/data ext4 defaults 0 2 -
If an LVM mount is missing after reboot, reactivate it:
# Activate volume groups vgchange -ay # Mount the logical volume mount /dev/examplegroup/lv_data /mnt/data -
For NFS issues, check connectivity and restart services:
# Check NFS exports
showmount -e <NFS_SERVER_IP>

# Restart NFS service
systemctl restart nfs-server
🔍 Step 4: Is the Filesystem Corrupted?
👉 Power losses, unexpected shutdowns, and failing drives can cause corruption.
Check:
# Check kernel error messages
dmesg | grep -i "error"

# Check filesystem integrity (non-destructive)
fsck.ext4 -n /dev/sdX  # for ext4
xfs_repair -n /dev/sdX  # for XFS
Fix:
-
Repair the filesystem (if unmounted):
# Unmount first umount /dev/sdX # Run filesystem repair fsck -y /dev/sdX # for ext4 xfs_repair /dev/sdX # for XFS -
If corruption is severe, restore from backup:
# Restore using rsync
rsync -av /backup/mnt_data /mnt/data/
🔍 Step 5: Are You Out of Inodes?
You might have disk space but still can't create files? Check your inodes!
Check:
# Check inode usage
df -i

# Count files in current directory
find . -type f | wc -l
- If inode usage shows 100%, you can't create new files even with free space.
- This happens when you have too many small files.
Fix:
-
Clean up temporary files:
# Remove old files in /tmp rm -rf /tmp/* # Clean package cache (Debian/Ubuntu) apt-get clean -
Find and remove unnecessary files:
# List directories with most files
du -a | sort -n -r | head -n 10
Overview
This unit concentrates on the core tasks involved in operating running systems in a Linux environment, particularly with Red Hat Enterprise Linux (RHEL). It covers:
-
Understanding resource usage CPU, memory, disk I/O.
-
Become familiar with service management frameworks.
Learning Objectives
-
Monitor and Manage System Resources:
- Learn to track CPU, memory, disk, and network usage.
- Understand how to troubleshoot performance bottlenecks.
-
Master Service and Process Control:
- Gain proficiency with systemd for managing services and understanding dependency trees.
- Acquire the ability to identify, start, stop, and restart services and processes as needed.
-
Configure and Interpret System Logs:
- Explore journald and syslog-based logging to collect and store vital system events.
- Develop techniques to analyze log files for troubleshooting and security assessments.
-
Implement Scheduling and Automation:
Usecron,at, andsystemdtimers to automate recurring tasks. Understand how automated job scheduling improves reliability and reduces manual intervention.
These objectives ensure learners can sustain, troubleshoot, and improve actively running Linux systems within enterprise environments, reducing downtime and increasing system reliability.
Relevance & Context
Operating running systems is central to any Linux administrator’s responsibilities for several reasons:
System Stability and Performance:
- Continuous monitoring and immediate remediation of issues ensure critical services remain available and performant.
Proactive Problem Resolution:
- Effective log management and automation allow administrators to detect anomalies early, schedule essential maintenance, and minimize disruptions.
Security and Compliance:
- Logs are often the first line of evidence in security auditing and breach investigations.
- Regularly reviewing and correlating logs is crucial to maintaining a secure environment.
Enterprise Uptime and Reliability:
- In production environments, even brief outages can lead to significant operational and financial impacts.
- Proper management of running systems ensures high availability and robust service delivery.
Prerequisites
Before tackling the tasks of operating running systems, learners should possess:
-
Command-Line Proficiency:
Familiarity with fundamental shell commands, directory structures, and file management is critical to executing system operations efficiently. -
Basic text editing skills:
Ability to utilizevi,vim, or comparable text editing tool. Understanding of vi, vim, or comparable editing tool shortcuts and commands. -
Aware of system components:
Familiarity with computer hardware concepts such as computer processors, memory, and storage.
Key Terms and Definitions
Systemd
Journalctl
Cron / At / Systemd Timers
Daemon
Instructions
Fill out the worksheet as you progress through the lab and discussions. Hold your worksheets until the end to turn them in as a final submission packet.
Resources / Important Links
Downloads
The worksheet has been provided below. The document(s) can be transposed to
the desired format so long as the content is preserved. For example, the .txt
could be transposed to a .md file.
Unit 4 Recording
Discussion Post #1
Read this article: https://cio-wiki.org/wiki/Operations_Bridge
-
What terms and concepts are new to you?
-
Which pro seems the most important to you? Why?
-
Which con seems the most costly, or difficult to overcome to you? Why?
Discussion Post #2
Scenario:
Your team has no documentation around how to check out a server during an incident. Write out a procedure of what you think an operations person should be doing on the system they suspect is not working properly.
This may help, to get you started https://zeltser.com/media/docs/security-incident-survey-cheat-sheet.pdf?msc=Cheat+Sheet+Blog You may use AI for this, but let us know if you do.
The discussion posts are done in Discord threads. Click the 'Threads' icon on the top right and search for the discussion post.
Definitions
Detection:
Response:
Mitigation:
Reporting:
Recovery:
Remediation:
Lessons Learned:
After action review:
Operations Bridge:
Digging Deeper
-
Read about battle drills here https://en.wikipedia.org/wiki/Battle_drill
-
Why might it be important to practice incident handling before an incident occurs?
-
Why might it be important to understand your tools before an incident occurs?
Reflection Questions
-
What questions do you still have about this week?
-
How much better has your note taken gotten since you started? What do you still need to work on? Have you started using a different tool? Have you taken more notes?
If you are unable to finish the lab in the ProLUG lab environment we ask you
rebootthe machine from the command line so that other students will have the intended environment.
Resources / Important Links
Required Materials
- Rocky 9.4+ - ProLUG Lab
- Or comparable Linux box
- root or sudo command access
Downloads
The lab has been provided for convenience below:
Pre-Lab Warm-Up
cd ~lsmkdir unit4mkdir unit4/test/round6- This fails.
mkdir -p unit4/test/round6- This works, think about why. (
man mkdir)
- This works, think about why. (
cd unit4ps- Read
man ps
- Read
ps -ef- What does this show differently?
ps -ef | grep -i root- What is the PID of the 4th line?
ps -ef | grep -i root | wc -l- What does this show you and why might it be useful?
top- Use
qto exit. - Inside top, use
hto find commands you can use to toggle system info.
- Use
Pre-Lab - Disk Speed tests:
-
Real quick check for a package that is useful.
rpm -qa | grep -i iostat #should find nothing -
Let's find what provides iostat by looking in the YUM (we'll explore more in later lab)
dnf whatprovides iostat- This should tell you that
sysstatprovidesiostat.
- This should tell you that
-
Let's check to see if we have it
rpm -qa | grep -i sysstat -
If you don't, lets install it
dnf install sysstat -
Re-check to verify we have it now
rpm -qa | grep -I sysstat
rpm -qi sysstat<version>
iostat # We'll look at this more in a bit
While we're working with packages, make sure that Vim is on your system.
This is the same procedure as above.rpm -qa | grep -i vim # Check if vim is installed # If it's there, good. dnf install vim # If it's not, install it so you can use vimtutor later (if you need help with vi commands)
Lab 🧪
-
Gathering system information release and kernel information
cat /etc/*release
uname
uname -a
uname -r
Run
man unameto see what those options mean if you don't recognize the valuesrpm -qa | grep -i kernelWhat is your kernel number? Highlight it (copy in putty)
rpm -qi <kernel from earlier>What does this tell you about your kernel? When was the kernel last updated? What license is your kernel released under?
-
Check the number of disks
fdisk -l ls /dev/sd*- When might this command be useful?
- What are we assuming about the disks for this to work?
- How many disks are there on this system?
- How do you know if it's a partition or a disk?
pvs # What system are we running if we have physical volumes?
    # What other things can we tell with vgs and lvs?
-
Use
pvdisply,vgdisplay, andlvdisplayto look at your carved up volumes.
Thinking back to last week's lab, what might be interesting from each of those? -
Try a command like
lvdisplay | egrep "Path|Size"and see what it shows.- Does that output look useful?
- Try to
egrepon some other values. Separate with|between search items.
-
Check some quick disk statistics
iostat -d
iostat -d 2   # Wait for a while, then use crtl + c to break. What did this do? Try changing this to a different number.
iostat -d 2 5 # Don't break this, just wait. What did this do differently? Why might this be useful?
-
Check the amount of RAM
cat /proc/meminfo free free -m- What do each of these commands show you? How are they useful?
-
Check the number of processors and processor info
cat /proc/cpuinfoWhat type of processors do you have? Google to try to see when they were released. Look at the flags. Sometimes when compiling these are important to know. This is how you check what execution flags your processor works with.
cat /proc/cpuinfo | grep proc | wc -l- Does this command accurately count the processors?
- Check some quick processor statistics
iostat -c
iostat -c 2 # Wait for a while, then use Ctrl+C to break. What did this do? Try changing this to a different number.
iostat -c 2 5 # Don't break this, just wait. What did this do differently? Why might this be useful?
Does this look familiar to what we did earlier with iostat?
-
Check the system uptime
uptime
man uptime
Read
man uptimeand figure out what those 3 numbers represent.
Referencing this server, do you think it is under high load? Why or why not? -
Check who has recently logged into the server and who is currently in
lastLast is a command that outputs backwards. (Top is most recent). So it is less than useful without using the more command.
last | more- Were you the last person to log in? Who else has logged in today?
How many other users are on this system? What does thew who whoamipts/0mean on Google?
- Were you the last person to log in? Who else has logged in today?
-
Check running processes and services
ps -aux | more ps -ef | more ps -ef | wc -l- Try to use what you've learned to see all the processes owned by your user
- Try to use what you've learned to count up all of those processes owned by your user
-
Looking at system usage (historical)
- Check processing for last day
sar | more - Check memory for the last day
sar -r | more
- Check processing for last day
Sar is a tool that shows the 10 minute weighted average of the system for the last day.
Sar is tremendously useful for showing long periods of activity and system load. It is exactly the opposite in it's usefulness of spikes or high traffic loads. In a 20 minute period of 100% usage a system may just show to averages times of 50% and 50%, never actually giving accurate info.
Problems typically need to be proactively tracked by other means, or with scripts, as we will see below.
Sar can also be run interactively. Run the command yum whatprovides sar and you will see that it is the
sysstat package. You may have guessed that sar runs almost exactly like iostat.
-
Try the same commands from earlier, but with their interactive information:
sar 2 # Ctrl+C to break sar 2 5 # or sar -r 2 sar -r 2 5 -
Check sar logs for previous daily usage
cd /var/log/sa/
ls
# Sar logfiles will look like: sa01 sa02 sa03 sa04 sa05 sar01 sar02 sar03 sar04
sar -f sa03 | head
sar -r -f sa03 | head #should output just the beginning of 3 July (whatever month you're in).
Most Sar data is kept for just one month but is very configurable. Read
man sarfor more info.
Sar logs are not kept in a readable format, they are binary. So if you needed to dump all the sar logs from a server, you'd have to output it to a file that is readable.
You could do something like this:
-
Gather information and move to the right location
cd /var/log/sa
pwd
ls
We know the files we want are in this directory and all look like this
sa* -
Build a loop against that list of files
for file in `ls /var/log/sa/sa??`; do echo "reading this file $file"; done -
Execute that loop with the output command of sar instead of just saying the filename
for file in `ls /var/log/sa/sa?? | sort -n`; do sar -f $file ; done -
But that is too much scroll, so let's also send it to a file for later viewing
for file in `ls /var/log/sa/sa?? | sort -n`; do sar -f $file | tee -a /tmp/sar_data_`hostname`; done -
Let's verify that file is as long as we expect it to be:
ls -l /tmp/sar_data* cat /tmp/sar_data_<yourhostname> | wc -l -
Is it what you expected? You can also visually check it a number of ways
cat /tmp/<filename>
more /tmp/<filename>
Exploring Cron:
Your system is running the cron daemon. You can check with:
ps -ef | grep -i cron
systemctl status crond
This is a tool that wakes up between the 1st and 5th second of every minute and checks to see if it has any tasks it needs to run. It checks in a few places in the system for these tasks. It can either read from a crontab or it can execute tasks from files found in the following locations.
/var/spool/cron is one location you can ls to check if there are any crontabs on your system.
The other locations are directories found under:
ls -ld /etc/cron*
These should be self-explanatory in their use. If you want to see if the user you are running has a crontab,
use the command crontab -l. If you want to edit (using your default editor, probably vi), use crontab -e.
We'll make a quick crontab entry and I'll point you here if you're interested in learning more.
Crontab format looks like this picture:
# .------- Minute (0 - 59)
# | .------- Hour (0 - 23)
# | | .------- Day of month (1 - 31)
# | | | .------- Month (1 - 12)
# | | | | .------- Day of week (0 - 6) (Sunday to Saturday - Sunday is also 7 on some systems)
# | | | | |
# | | | | |
  * * * * *  command to be executed
Let's do these steps.
crontab -e- Add this line (using vi commands - Revisit
vimtutorif you need help with them)
* * * * * echo 'this is my cronjob running at' `date` | wall
- Verify with
crontab -l. - Wait to see if it runs and echos out to wall.
cat /var/spool/cron/rootto see that it is actually stored where I said it was.- This will quickly become very annoying, so I recommend removing that line, or commenting it
out (
#) from that file.
We can change all kinds of things about this to execute at different times. The one above, we executed every minute through all hours, of every day, of every month.
We could also have done some other things:
-
Every 2 minutes (divisible by any number you need):
*/2 * * * * -
The first and 31st minute of each hour:
1,31 * * * * -
The first minute of every 4th hour:
1 */4 * * * -
NOTE: If you're adding system-wide cron jobs (
/etc/crontab), you can also specify the user to run the command as.* * * * * <user> <command>
There's a lot there to explore, I recommend looking into the Cron wiki or tldp.org's cron guide for more information.
That's all for this week's lab. There are a lot of uses for all of these tools above. Most of what I've shown here, I'd liken to showing you around a tool box. Nothing here is terribly useful in itself, the value comes from knowing the tool exists and then being able to properly apply it to the problem at hand.
I hope you enjoyed this lab.
Be sure to
rebootthe lab machine from the command line when you are done.
Overview
This unit focuses on managing user's environments and scanning and enumerating Systems.
- Become familiar with networking scanning tools
- Understand the functionality systems files and customized .(dot) files.
Learning Objectives
- Become familiar with Networking mapping:
- Learn how to find your network inventory by using nmap.
- Grasp the basics of targeted scans by scanning virtual boxes and creating a report.
- Explore the system files:
- Understand the structure of the /etc/passwd file by using the cat command.
- Customize the /etc/skel file to create a default shell environment for the users.
Prerequisites
- Basic understanding of networking.
- Familiarity with nmap.
- Intermediate understanding of file manipulation commands.
- General idea of bash scripting.
Key Terms and Definitions
Footprinting
Scanning
Enumeration
System Hacking
Escalation of Privilege
Rule of Least Privilege
Covering Tracks
Planting Backdoors
Instructions
Fill out the worksheet as you progress through the lab and discussions. Hold your worksheets until the end to turn them in as a final submission packet.
Resources / Important Links
Downloads
The worksheet has been provided below. The document(s) can be transposed to
the desired format so long as the content is preserved. For example, the .txt
could be transposed to a .md file.
Unit 5 Recording
Discussion Post #1
Review the page: https://attack.mitre.org/
-
What terms and concepts are new to you?
-
Why, as a system administrator and not directly in security, do you think it’s so important to understand how your systems can be attacked? Isn’t it someone else’s problem to think about that?
-
What impact to the organization is data exfiltration? Even if you’re not a data owner or data custodian, why is it so important to understand the data on your systems?
Discussion Post #2
Find a blog or article on the web that discusses the user environment in Linux.
You may want to search for .bashrc or (dot) environment files in Linux.
-
What types of customizations might you setup for your environment? Why?
-
What problems can you anticipate around helping users with their dot files?
The discussion posts are done in Discord threads. Click the 'Threads' icon on the top right and search for the discussion post.
Definitions
Footprinting:
Scanning:
Enumeration:
System Hacking:
Escalation of Privilege:
Rule of least privilege:
Covering Tracks:
Planting Backdoors:
Digging Deeper
Map the Internal ProLUG Network (192.168.200.0/24):
-
Map the network from one of the rocky nodes.
Using a template that you build or find from the internet, provide a 1 page summary of what you find in the network. -
Read this page: https://owasp.org/www-project-top-ten/
- What is the OWASP Top Ten?
- Why is this important to know as a system administrator?
-
Read this article: https://www.cobalt.io/blog/defending-against-23-common-attack-vectors
- What is an attack vector?
- Why might it be a good idea to keep up to date with these?
Reflection Questions
- What questions do you still have about this week?
- How are you going to use what you’ve learned in your current role?
If you are unable to finish the lab in the ProLUG lab environment we ask you
rebootthe machine from the command line so that other students will have the intended environment.
Resources / Important Links
- Killercoda Labs
- RedHat: User and Group Management
- Rocky Linux User Admin Guide
- Killercoda lab by FishermanGuyBro
Required Materials
- Rocky 9.4+ - ProLUG Lab
- Or comparable Linux box
- root or sudo command access
Downloads
The lab has been provided for convenience below:
Pre-Lab Warm-Up
Exercises (Warmup to quickly run through your system and practice commands)
mkdir lab_userscd /lab_userscat /etc/passwd- We'll be examining the contents of this file later
cat /etc/passwd | tail -5- What did this do to the output of the file?
cat /etc/passwd | tail -5 | nlcat /etc/passwd | tail -5 | awk -F : '{print $1, $3, $7}'- What did that do and what do each of the
$#represent? - Can you give the 2nd, 5th, and 6th fields?
- What did that do and what do each of the
cat /etc/passwd | tail -5 | awk -F : '{print $NF}'- What does this
$NFmean? Why might this be useful to us as administrators?
- What does this
alias- Look at the things you have aliased.
- These come from defaults in your
.bashrcfile. We'll configure these later
cd /rootls -lll- Output should be similar.
unalias llll- You shouldn't have this command available anymore.
lsunalias ls- How did
lschange on your screen?
- How did
No worries, there are two ways to fix the mess you've made.
Nothing you've done is permanent, so logging out and reloading a shell (logging back in) would fix this.
We just put the aliases back.
alias ll='ls -l --color=auto'alias ls='ls --color=auto'- Test with
aliasto see them added and also usellandlsto see them work properly.
- Test with
Lab 🧪
This lab is designed to help you get familiar with the basics of the systems you will be working on.
Some of you will find that you know the basic material but the techniques here allow you to put it together in a more complex fashion.
It is recommended that you type these commands and do not copy and paste them. Browsers sometimes like to format characters in a way that doesn't always play nice with Linux.
The Shadow password suite:
There are 4 files that comprise of the shadow password suite. We'll investigate them a bit and look at
how they secure the system. The four files are /etc/passwd, /etc/group, /etc/shadow, and /etc/gshadow.
-
Look at each of the files and see if you can determine some basic information about them
more /etc/passwd
more /etc/group
more /etc/shadow
more /etc/gshadow
There is one other file you may want to become familiar with:
more /etc/login.defsCheck the file permissions:
ls -l /etc/passwdDo this for each file to see how their permissions are set.
You may note that
/etc/passwdand/etc/groupare readable by everyone on the system but/etc/shadowand/etc/gshadoware not readable by anyone on the system. -
Anatomy of the
/etc/passwdfile/etc/passwdis broken down like this, a:(colon) delimited file:Username Password User ID (UID) Group ID (GID) User Info Home Directory Login Shell puppetx994991Puppet server daemon/opt/puppetlabs/server/data/puppetserver/sbin/nologin
cat or more the file to verify these are values you see.
Are there always 7 fields?
-
Anatomy of the
/etc/groupfile/etc/groupis broken down like this, a:(colon) delimited file:Groupname Password Group ID Group Members puppetx991foreman, foreman-proxycatormorethe file to verify these are the values you see. Are there always 4 fields?
-
We're not going to break down the
gfiles, but there are a lot of resources online that can show you this same information. Suffice it to say, the passwords, if they exist, are stored in an md5 digest format up to RHEL 5. RHEL 6,7,8 and 9 use SHA-512 hash. We cannot allow these to be read by just anyone because then they could brute force and try to figure out our passwords.
Creating and modifying local users:
We should take a second to note that the systems you're using are tied into our active directory with
Kerberos. You will not be seeing your account in /etc/passwd, as that authentication is occurring
remotely. You can, however, run id <username> to see user information about yourself that you have
according to active directory.
Your /etc/login.defs file is default and contains a lot of the values that control how our next commands
work
-
Creating users
useradd user1
useradd user2
useradd user3
Do a quick check on our main files:
tail -5 /etc/passwd
tail -5 /etc/shadow
What
UIDandGIDwere each of these given? Do they match up? Verify your users all have home directories. Where would you check this?ls /homeYour users
/home/<username>directories have hidden files that were all pulled from a directory called/etc/skel. If you wanted to test this and verify you might do something like this:cd /etc/skel vi .bashrcUse
vicommands to add the line:alias dinosaur='echo "Rarw"'Your file should now look like this:
# .bashrc
# Source global definitions
if [ -f /etc/bashrc ]; then
. /etc/bashrc
fi
alias dinosaur='echo "Rarw"'
# Uncomment the following line if you don't like systemctl's auto-paging feature:
# export SYSTEMD_PAGER=
# User specific aliases and functions
Save the file with
:wq.useradd user4 su - user4 dinosaur # Should roar out to the screenDoing that changed the
.bashrcfile for all new users that have home directories created on the server. An old trick, when users mess up their login files (all the.files), is to move them all to a directory and pull them from/etc/skelagain. If the user can log in with no problems, you know the problem was something they created.We can test this with the same steps on an existing user. Pick an existing user and verify they don't have that command
su - user1
dinosaur # Command not found
exit
Then, as root:
cd /home/user1 mkdir old_dot_files mv .* old_dot_files # Ignore the errors, those are directories cp /etc/skel/.* /home/user1 # Ignore the errors, those are directories su - user1 dinosaur # Should 'roar' now because the .bashrc file is new from /etc/skel -
Creating groups From our
/etc/login.defswe can see that the default range for UIDs on this system, when created byuseraddare:UID_MIN 1000 UID_MAX 60000So an easy way to make sure that we don't get confused on our group numbering is to ensure we create groups outside of that range. This isn't required, but can save you headache in the future.
groupadd -g 60001 project
tail -5 /etc/group
You can also make groups the old fashioned way by putting a line right into the
/etc/groupfile.
Try this:vi /etc/group- Shift+G to go to the bottom of the file.
- Hit
oto create a new line and go to insert mode. - Add
project2:x:60002:user4 - Hit
Esc :wq!to write quit the file explicit force because it's a read only file.
id user 4 # Should now see the project2 in the user's groups -
Modifying or deleting users So maybe now we need to move our users into that group.
usermod -G project user4
tail -f /etc/group # Should see user4 in the group
But, maybe we want to add more users and we want to just put them in there:
vi /etc/groupShift+GWill take you to the bottom.- Hit
i(will put you into insert mode). - Add
,user1,user2afteruser4. - Hit
Esc. :wqto save and exit.
Verify your users are in the group now
id user4 id user1 id user2 -
Test group permissions I included the permissions discussion from an earlier lab because it's important to see how permissions affect what user can see what information.
Currently we have
user1,2,4belonging to groupprojectbut notuser3. So we will verify these permissions are enforced by the filesystem.mkdir /project ls -ld /project chown root:project /project chmod 775 /project ls -ld /projectIf you do this, you now have a directory
/projectand you've changed the group ownership to/project. You've also given groupprojectusers the ability to write into your directory. Everyone can still read from your directory. Check permissions with users:su - user1 cd /project touch user1 exit su - user3 cd /project touch user3 exitAnyone not in the
projectgroup doesn't have permissions to write a file into that directory. Now, as the root user:chmod 770 /projectCheck permissions with users:
su - user1
cd /project
touch user1.1
exit
su - user3
cd /project # Should break right about here
touch user3
exit
You can play with these permissions a bit, but there's a lot of information online to help you understand permissions better if you need more resources.
Working with permissions:
Permissions have to do with who can or cannot access (read), edit (write), or execute (xecute)files. Permissions look like this:
ls -l
| Permission | # of Links | UID Owner | Group Owner | Size (b) | Creation Month | Creation Day | Creation Time | Name of File |
|---|---|---|---|---|---|---|---|---|
-rw-r--r--. | 1 | scott | domain_users | 58 | Jun | 22 | 08:52 | datefile |
The primary permissions commands we're going to use are going to be chmod (access) and chown (ownership).
A quick rundown of how permissions break out:
Let's examine some permissions and see if we can't figure out what permissions are allowed:
ls -ld /home/scott/
drwx------. 5 scott domain_users 4096 Jun 22 09:11 /home/scott/
The first character lets you know if the file is a directory, file, or link. In this case we are looking at my home directory.
rwx: For UID (me).
- What permissions do I have?
---: For group.
- Who are they?
- What can my group do?
---: For everyone else.
- What can everyone else do?
Go find some other interesting files or directories and see what you see there.
Can you identify their characteristics and permissions?
Be sure to
rebootthe lab machine from the command line when you are done.
Overview
This unit focuses on Nohup environments and firewalls.
- We will cover Nohup tools and how to properly use Nohup environments.
- We will explore different types of firewalls and learn the use cases for each firewall type.
Learning Objectives
-
Become familiar with the
nohupcommand:- Learn real-life use cases of the
nohupcommand. - Understand the correlation between jump boxes and Nohup environments, including
screenandtmux.
- Learn real-life use cases of the
-
Implement and manage Nohup environments:
- Learn how
nohupallows processes to continue running after a user logs out, ensuring that long-running tasks are not interrupted. - Develop skills in managing background processes effectively using
nohup,screen, andtmux.
- Learn how
-
Develop effective troubleshooting methodologies:
- Acquire systematic approaches to diagnosing firewall misconfigurations, network connectivity issues, and unauthorized access attempts.
- Apply structured troubleshooting strategies to minimize downtime and maintain high availability.
Prerequisites
- A basic understanding of how processes work.
- Familiarity with the
firewalldservice. - The ability to understand
.xmlfiles.
Key Terms and Definitions
Firewall
Zone
Service
DMZ (Demilitarized Zone)
Proxy
Stateful Packet Filtering
Stateless Packet Filtering
WAF (Web Application Firewall)
NGFW (Next-Generation Firewall):
Instructions
Fill out the worksheet as you progress through the lab and discussions. Hold your worksheets until the end to turn them in as a final submission packet.
Resources / Important Links
- Official Firewalld Documentation
- RedHat Firewalld Documentation
- Official UFW Documentation
- Wikipedia entry for Next-Gen Firewalls
Downloads
The worksheet has been provided below. The document(s) can be transposed to
the desired format so long as the content is preserved. For example, the .txt
could be transposed to a .md file.
Unit 6 Recording
Discussion Post #1
Scenario:
A ticket has come in from an application team. Some of the servers your team built for them last week have not been reporting up to enterprise monitoring and they need it to be able to troubleshoot a current issue, but they have no data. You jump on the new servers and find that your engineer built everything correctly and the agents for node_exporter, ceph_exporter and logstash exporter that your teams use. But, they also have adhered to the new company standard of firewalld must be running. No one has documented the ports that need to be open, so you’re stuck between the new standards and fixing this problem on live systems.
Next, answer these questions here:
-
As you’re looking this up, what terms and concepts are new to you?
-
What are the ports that you need to expose? How did you find the answer?
-
What are you going to do to fix this on your firewall?
Discussion Post #2
Scenario:
A manager heard you were the one that saved the new application by fixing the firewall. They get your manager to approach you with a request to review some documentation from a vendor that is pushing them hard to run a WAF in front of their web application. You are “the firewall” guy now, and they’re asking you to give them a review of the differences between the firewalls you set up (which they think should be enough to protect them) and what a WAF is doing.
-
What do you know about the differences now?
-
What are you going to do to figure out more?
-
Prepare a report for them comparing it to the firewall you did in the first discussion.
Submit your input by following the link below.
The discussion posts are done in Discord Forums.
Definitions
Firewall:
Zone:
Service:
DMZ:
Proxy:
Stateful packet filtering:
Stateless packet filtering:
WAF:
NGFW:
Digging Deeper
- Read https://docs.rockylinux.org/zh/guides/security/firewalld-beginners/
What new things did you learn that you didn’t learn in the lab?
What functionality of firewalld are you likely to use in your professional work?
Reflection Questions
- What questions do you still have about this week?
- How are you going to use what you’ve learned in your current role?
If you are unable to finish the lab in the ProLUG lab environment we ask you
rebootthe machine from the command line so that other students will have the intended environment.
Resources / Important Links
Required Materials
- Rocky 9.4+ - ProLUG Lab
- Or comparable Linux box
- root or sudo command access
Downloads
The lab has been provided for convenience below:
Pre-Lab Warm-Up
Exercises (Warmup to quickly run through your system and practice commands)
cd~pwd (should be /home/<yourusername>)cd /tmppwd (should be /tmp)cdpwd (should be /home/<yourusername>)mkdir lab_firewalldcd lab_firewalldtouch testfile1lstouch testfile{2..10}lsseq 10seq 1 10seq 1 2 10- man seq and see what each of those values mean. It’s important to know the behavior if you intend to ever use the command, as we often do with counting (for) loops.
No worries, there are two ways to fix the mess you've made.
Nothing you've done is permanent, so logging out and reloading a shell (logging back in) would fix this.
We just put the aliases back.
for i inseq 1 10; do touch file$i; done;ls- Think about some of those commands and when you might use them. Try to change command #15 to remove all of those files (rm -rf file$i)
Lab 🧪
This lab is designed to help you get familiar with the basics of the systems you will be working on.
Some of you will find that you know the basic material but the techniques here allow you to put it together in a more complex fashion.
It is recommended that you type these commands and do not copy and paste them. Browsers sometimes like to format characters in a way that doesn't always play nice with Linux.
Check Firewall Status and settings:
A very important thing to note before starting this lab. You’re connected into that server on ssh via port 22. If you do anything to lockout port 22 in this lab, you will be blocked from that connection and we’ll have to reset it.
-
Check firewall status
systemctl status firewalldExample Output:
firewalld.service - firewalld - dynamic firewall daemon
Loaded: loaded (/usr/lib/systemd/system/firewalld.service; enabled; vendor preset: enabled)
Active: inactive (dead) since Sat 2017-01-21 19:27:10 MST; 2 weeks 6 days ago
 Main PID: 722 (code=exited, status=0/SUCCESS)

Jan 21 19:18:11 schampine firewalld[722]: 2017-01-21 19:18:11 ERROR: COMMAND....
Jan 21 19:18:13 schampine firewalld[722]: 2017-01-21 19:18:13 ERROR: COMMAND....
Jan 21 19:18:13 schampine firewalld[722]: 2017-01-21 19:18:13 ERROR: COMMAND....
Jan 21 19:18:13 schampine firewalld[722]: 2017-01-21 19:18:13 ERROR: COMMAND....
Jan 21 19:18:13 schampine firewalld[722]: 2017-01-21 19:18:13 ERROR: COMMAND....
Jan 21 19:18:14 schampine firewalld[722]: 2017-01-21 19:18:14 ERROR: COMMAND....
Jan 21 19:18:14 schampine firewalld[722]: 2017-01-21 19:18:14 ERROR: COMMAND....
Jan 21 19:18:14 schampine firewalld[722]: 2017-01-21 19:18:14 ERROR: COMMAND....
Jan 21 19:27:08 schampine systemd[1]: Stopping firewalld - dynamic firewall.....
Jan 21 19:27:10 schampine systemd[1]: Stopped firewalld - dynamic firewall ...n.
Hint: Some lines were ellipsized, use -l to show in full.
If necessary start the firewalld daemon:
systemctl start firewalld
Set the firewalld daemon to be persistent through reboots:
systemctl enable firewalld
Verify with systemctl status firewalld again from step 1
Check which zones exist:
firewall-cmd --get-zones
Checking the values within each zone:
firewall-cmd --list-all --zone=public
General Output
public (default, active)
interfaces: wlp4s0
sources:
services: dhcpv6-client ssh
ports:
masquerade: no
forward-ports:
icmp-blocks:
rich rules:
Checking the active and default zones:
firewall-cmd --get-default
Example Output:
public
Next Command
firewall-cmd --get-active-zones
Example Output:
public
interfaces: wlp4s0
Note: this also shows which interface the zone is applied to. Multiple interfaces and zones can be applied
So now you know how to see the values in your firewall. Use steps 4 and 5 to check all the values of the different zones to see how they differ.
Set the firewall active and default zones:
We know the zones from above, set your firewall to the different active or default zones. Default zones are the ones that will come up when the firewall is restarted.
Note: It may be useful to perform an ifconfig -a and note your interfaces for the next part
ifconfig -a | grep -i flags
Example Output:
ifconfig -a | grep -i flags
docker0: flags=4099<UP,BROADCAST,MULTICAST>  mtu 1500
ens32: flags=4163<UP,BROADCAST,RUNNING,MULTICAST>  mtu 1500
lo: flags=73<UP,LOOPBACK,RUNNING>  mtu 65536
- Changing the default zones (This is permanent over a reboot, other commands require --permanent switch)
firewall-cmd --set-default-zone=work
Example Output:
success
Next Command:
firewall-cmd --get-active-zones
Example Output:
work
    interfaces: wlp4s0
Attempt to set it back to the original public zone and verify. Set it to one other zone, verify, then set it back to public.
Changing interfaces and assigning different zones (use another interface from your earlier ifconfig -a
firewall-cmd --change-interface=virbr0 --zone dmz
Example Output:
success
Next Command:
firewall-cmd --add-source 192.168.11.0/24 --zone=public
Example Output:
success
Next Command:
firewall-cmd --get-active-zones
Example Output:
dmz
   interfaces: virbr0
work
   interfaces: wlp4s0
public
   sources: 192.168.200.0/24
Working with ports and services:
We can be even more granular with our ports and services. We can block or allow services by port number, or we can assign port numbers to a service name and then block or allow those service names.
-
List all services assigned in firewalld
firewall-cmd --get-servicesExample Output:
RH-Satellite-6 amanda-client bacula bacula-client dhcp dhcpv6 dhcpv6-client dns freeipa-ldap freeipa-ldaps freeipa-replication ftp high-availability http https imaps ipp ipp-client ipsec iscsi-target kerberos kpasswd ldap ldaps libvirt libvirt-tls mdns mountd ms-wbt mysql nfs ntp openvpn pmcd pmproxy pmwebapi pmwebapis pop3s postgresql proxy-dhcp radius rpc-bind rsyncd samba samba-client smtp ssh telnet tftp tftp-client transmission-client vdsm vnc-server wbem-httpsThis next part is just to show you where the service definitions exist. They are simple xml format and can easily be manipulated or changed to make new services. This would require a restart of the firewalld service to re-read this directory.
Next Command:
ls /usr/lib/firewalld/services/Example Output:
amanda-client.xml        iscsi-target.xml  pop3s.xml
bacula-client.xml        kerberos.xml      postgresql.xml
bacula.xml               kpasswd.xml       proxy-dhcp.xml
dhcpv6-client.xml        ldaps.xml         radius.xml
dhcpv6.xml               ldap.xml          RH-Satellite-6.xml
dhcp.xml                 libvirt-tls.xml   rpc-bind.xml
dns.xml                  libvirt.xml       rsyncd.xml
freeipa-ldaps.xml        mdns.xml          samba-client.xml
freeipa-ldap.xml         mountd.xml        samba.xml
freeipa-replication.xml  ms-wbt.xml        smtp.xml
ftp.xml                  mysql.xml         ssh.xml
high-availability.xml    nfs.xml           telnet.xml
https.xml                ntp.xml           tftp-client.xml
http.xml                 openvpn.xml       tftp.xml
imaps.xml                pmcd.xml          transmission-client.xml
ipp-client.xml           pmproxy.xml       vdsm.xml
ipp.xml                  pmwebapis.xml     vnc-server.xml
ipsec.xml                pmwebapi.xml      wbem-https.xml
Next Command:
cat /usr/lib/firewalld/services/http.xmlExample Output:
<?xml version="1.0" encoding="utf-8"?> <service> <short>WWW (HTTP)</short> <description>HTTP is the protocol used to serve Web pages. If you plan to make your Web server publicly available, enable this option. This option is not required for viewing pages locally or developing Web pages.</description> <port protocol="tcp" port="80"/> </service> -
Adding a service or port to a zone
Ensuring we are working on a public zone
firewall-cmd --set-default-zone=publicExample Output:
successListing Services
firewall-cmd --list-servicesExample Ouput:
dhcpv6-client sshNote: We have 2 services
Permanently adding a service with the
--permanentswitchfirewall-cmd --permanent --add-service ftpExample Output:
successReloading
firewall-cmd --reloadExample Output:
successVerifying we are in the correct Zone
firewall-cmd --get-default-zoneExample Output:
publicVerifying that we have successfully added the FTP service
firewall-cmd --list-servicesExample Output:
dhcpv6-client ftp sshAlternatively, we can do almost the same thing but not use a defined service name. If I just want to allow port 1147 through for TCP traffic, it is very simple as well.
firewall-cmd --permanent --add-port=1147/tcpExample Output:
successReloading once again
firewall-cmd --reloadExample Output:
successListing open ports now
firewall-cmd --list-portsExample Output:
1147/tcp -
Removing unwanted services or ports
To remove those values and permanently fix the configuration back we simply use remove.
Firstly, we will permanently remove ftp service
firewall-cmd --permanent --remove-service=ftpExample Output:
successThen we will permanently remove the ports
firewall-cmd --permanent --remove-port=1147/tcpExample Output:
successNow lets do a reload
firewall-cmd --reloadExample Output:
successNow we can list services again to confirm our work
firewall-cmd --list-servicesExample Output:
dhcpv6-client sshNow we can list ports
firewall-cmd --list-portsExample Output:
NothingBefore making any more changes I recommend running the
listcommands above with>> /tmp/firewall.origon them so you have all your original values saved somewhere in case you need them.
So now take this and set up some firewalls on the interfaces of your system.
Change the default ports and services assigned to your different zones (at least 3 zones)
Read the man firewall-cmd command or firewall-cmd -help to see if there are any other userful things you should know.
Be sure to
rebootthe lab machine from the command line when you are done.
NOTE: This is an optional bonus section. You do not need to read it, but if you're interested in digging deeper, this is for you.
Enhance productivity by enabling the management of multiple sessions and windows from a single remote session.
Key Features of Terminal Multiplexors
Create Multiple Windows/Panes 🪟
Split your terminal into panes (or windows) so you can run different commands or tasks simultaneously.
Detach and Reattach Sessions 🪝
You can detach from a session (e.g., when you log out of a remote server), and later reattach to it exactly as you left it.
Persistence of Long-Running Tasks
If your network connection drops, the tasks keep running on the server, and you can reattach to them later.
Collaborate
Some terminal multiplexers allow multiple users to connect to the same session, enabling collaborative work on a single system.
Popular Terminal Multiplexors
Tmux
- Is widely used by developers and system administrators for its flexible configuration and vibrant community support.
- Its popularity also stems from its straightforward scripting capabilities, making it highly useful for automation.
Tmux Resources
Tmux, a terminal multiplexer written in C, emerged around 2007, noted for its customizable configuration and scripting. Despite its popularity and flexibility, users occasionally report stability issues and complex scripting. Tmux, crafted in 2007 by Nicholas Marriott in C, marked an evolution from GNU Screen. Its flexible configuration appeals to system admins, despite some users finding the setup syntax intricate. Tmux, created by Nicholas Marriott in 2007, is a C-based terminal multiplexer famous for its configuration flexibility and scripting prowess, but newcomers often find its syntax intricate.
GNU Screen
GNU Screen, created by Oliver Laumann in 1987 and written in C, became one of the first mainstream terminal multiplexers, remaining a staple in many Linux distributions. Praised for its stability and included by default in numerous systems, it can still be considered less intuitive in configuration compared to newer options like tmux.
- is one of the original terminal multiplexers and remains popular due to its reliable, time-tested features.
- It continues to be bundled with many Linux distributions by default, contributing to its enduring user base.
GNU Screen Resources
Zellij
Zellij, first released in 2020 and written in Rust, is a newcomer to the terminal multiplexer space that focuses on an intuitive UI and easy collaboration. While its modern approach and built-in layout management offer clear advantages over older tools, its relatively small community and limited ecosystem may pose challenges for widespread adoption.
- Although not yet included in the default repositories of all distributions, Zellij is rapidly gaining visibility because of its modern design and user-friendly layout management.
- Its growing ecosystem of plugins and emphasis on collaboration make it an attractive choice for developers seeking a more advanced terminal multiplexer.
Zellij Resources
Downloads
Overview
Managing software on a Linux system involves two essential practices: package management and patching. Together, they ensure that systems remain functional, up-to-date, and secure by handling software installation, updates, and vulnerability remediation.
-
Package Management: the system used to install, upgrade, configure, and remove software packages while automatically resolving dependencies and maintaining system consistency.
-
Patching: the process of applying updates to software packages or the kernel to fix bugs, close security vulnerabilities, or improve performance.
Learning Objectives
- Become Familiar with Package Management:
- In this unit you will see what comprises a RPM, YUM, and RPM package and how professional administrators carefully choose what is installed on a system.
- Become Familiar with Patching:
- Learn about general patching cycles.
- Understand why it matters to inpsect packages and associated dependancies.
- Get hands on with inspecting packages.
Relevance & Context
The skills taught in this unit are indispensable for several reasons:
-
Efficient System Management:
The RHEL environment is typically managed via the command line. Proficiency in the CLI, along with an in-depth understanding of the file system, is crucial for daily tasks like system configuration, package management (using tools such as YUM or DNF), and remote troubleshooting. -
Security and Stability:
Editing configuration files, managing system services, and monitoring logs are all critical tasks that ensure the secure and stable operation of RHEL systems. A robust understanding of these basics is necessary to mitigate risks and ensure compliance with enterprise security standards. -
Professional Certification & Career Growth:
For those pursuing certifications like the Red Hat Certified System Administrator (RHCSA) or Red Hat Certified Engineer (RHCE), these foundational skills are not only testable requirements but also a stepping stone for more advanced topics such as automation (using Ansible), container management (with Podman or OpenShift), and performance tuning. -
Operational Excellence:
In enterprise settings where uptime and rapid incident response are paramount, having a solid grasp of these fundamentals enables administrators to quickly diagnose issues, apply fixes, and optimize system performance—thereby directly impacting business continuity and service quality.
Prerequisites
- Lab Access
- Basic understanding of install or update software using DNF.
- Familiarity with terminal commands and accessing
manpages. - Basic understanding of editing config files using vi.
Key terms and Definitions
Yum
DNF
Repo
GPG Key
Software dependency
Software version
Semantic Version
Instructions
Fill out the worksheet as you progress through the lab and discussions. Hold your worksheets until the end to turn them in as a final submission packet.
Resources / Important Links
Downloads
The worksheet has been provided below. The document(s) can be transposed to
the desired format so long as the content is preserved. For example, the .txt
could be transposed to a .md file.
Unit 7 Recording
Discussion Post #1
-
Why is software versioning so important to software security?
-
Can you find 3 reasons, from the internet, AI, or your peers?
Discussion Post #2
Scenario:
You are new to a Linux team. A ticket has come in from an application team and has already been escalated to your manager.
They want software installed on one of their servers but you cannot find any documentation. Your security team is out to lunch and not responding.
You remember from some early documentation that you read that all the software in the internal repos you currently have are approved for deployment on servers. You want to also verify by checking other servers that this software exists.
This is an urgent task and your manager is hovering.
-
How can you check all the repos on your system to see which are active?
-
How would you check another server to see if the software was installed there?
-
If you find the software, how might you figure out when it was installed? (Time/Date)
Discussion Post #3
Scenario:
Looking at the concept of group install from DNF or Yum. Why do you think an administrator may never want to use that in a running system? Why might an engineer want to or not want to use that? This is a thought exercise, so it’s not a “right or wrong” answer it’s for you to think about.
-
What is the concept of software bloat, and how do you think it relates?
-
What is the concept of a security baseline, and how do you think it relates?
-
How do you think something like this affects performance baselines?
Submit your input by following the link below.
The discussion posts are done in Discord Forums.
Definitions
Yum:
DNF:
Repo:
GPG Key:
Software dependency:
Software version:
Semantic Version:
Digging Deeper
- What is semantic versioning? https://semver.org/
Reflection Questions
-
What questions do you still have about this week?
-
How does security as a system administrator differ from what you expected?
If you are unable to finish the lab in the ProLUG lab environment we ask you
rebootthe machine from the command line so that other students will have the intended environment.
Resources / Important Links
Required Materials
- Rocky 9.4+ - ProLUG Lab
- Or comparable Linux box
- root or sudo command access
Downloads
The lab has been provided for convenience below:
Pre-Lab Warm-Up
A couple commands to get the noodle and fingers warmed up.
For clarity:
DNF is the 'frontend' aspect of the Rocky package management apparatus and RPM (RHEL package manager) is the 'backend'. The frontend abstracts away and automates the necessary commands required to install and manipulate packages.
RPM allows for finer control compared to its related frontend and is intended for more advanced use cases. The Debian/Ubuntu equivalents are the apt frontend and dpkg backend.
Investigate the man pages for additional information.
cd ~
rpm -qa | more
rpm -qa | wc -l
# pick any <name of package> from the above list

rpm -qi {name of package}
rpm -qa | grep -i imagemagick

dnf install imagemagick

# What is the error here? Read it
dnf install ImageMagick

# What are some of the dependencies here? Look up the urw-base35
# and see what functionality that adds.
rpm -qa | grep -i imagemagick

# Why did this work when the other one didn’t with dnf?
Math Practice:
Some fun with the command line and basic scripting tools. I want you to see some of the capabilities that are available to you. Your system can do a lot of basic arithmetic for you and this is a very small set of examples.
# Check to see if you have bc tool.
rpm -q bc

#Install it if you need to
dnf install bc

for i in `seq 1 5`; do free | grep -i mem | awk '{print $3}'; done

# Collect the 5 numbers (what do these numbers represent? Use free to find out)
echo "(79 + 79 + 80 + 80 + 45) / 5" | bc

# Your numbers will vary. Is this effective? Is it precise enough?
echo "(79 + 79 + 80 + 80 + 45) / 5" | bc -l
# Is this precise enough for you?

# Read the man to see what the -l option does to bc
man bc
It would be astute to point out that I did not have you do bash arithmetic. There is a major limitation of using bash for that purpose in that it only wants to deal with integers (whole numbers) and you will struggle to represent statistical data with precision. There are very useful tools though, and I would highly encourage you to examine them. http://tldp.org/LDP/abs/html/arithexp.html
Lab 🧪
Log into your Rocky server and become root.
RPM:
RPM is the Redhat package manager. It is a powerful tool to see what is installed on your system and to see what dependencies exist with different software packages. This is a tool set that was born of the frustration of “dependency nightmare” where system admins used to compile from source code only to find they had dependencies. RPM helps to de-conflict and save huge amounts of time and engineering headaches.
Run through these commands and read man rpm to see what they do.
# Read about the capabilities of systemd
rpm -qi systemd

# query the package given
rpm -q systemd

# query all packages on the system (is better used with | more or | grep)
rpm -qa

#for example shows all kernels and kernel tools
rpm -qa | grep -i kernel

# List out files, but only show the configuration files
rpm -qc systemd

# What good information do you see here? Why might it be good to know
# that some piece of software was installed last night, if there is now
# a problem with the system starting last night?
rpm -qi systemd

# Will list all the files in the package. Why might this be useful to you to know?
rpm -ql systemd

# List capabilities on which this package depends
rpm -qR systemd

# Probably going to scroll too fast to read. This output is in reverse order.
rpm -q -changelog systemd

# So let’s make it useful with this command
rpm -q -changelog systemd | more

# What are some of the oldest entries?
# What is the most recent entry?
# Is there a newer version of systemd for you to use?

# If there isn’t don’t worry about it.
dnf update systemd
Use rpm -qa | more to find 3 other interesting packages and perform
rpm -qi <package> on them to see information about them.
DNF:
DNF is the front end package manager implemented into Rocky and derives its roots from Yum, a long decrepit version of Linux called Yellow dog. It is originally the Yellowdog Update Manager. It has a very interesting history surrounding the PS3, but that and other nostalgia can be found here: https://en.wikipedia.org/wiki/Yellow_Dog_Linux if you’re interested.
We’re going to use DNF to update our system. RHEL and CentOS systems look to repositories of software for installation and updates. We have a base set of them provided with the system, supported by the vendor or open source communities, but we can also create our own from file systems or web pages. We’ll be mostly dealing with the defaults and how to enable or disable them, but there are many configurations that can be made to customize software deployment.
# Checking how dnf is configured and seeing it’s available repositories
cat /etc/dnf/dnf.conf

# has some interesting information about what is or isn’t going to be checked.
# You can include a line here called exclude= to remove packages from installation
# by name. Where a repo conflicts with this, this takes precedence.
dnf repolist
dnf history

# Checking where repos are stored and what they look like
ls /etc/yum.repos.d/

# Repos are still stored in /etc/yum.repos.d
cat /etc/yum.repos.d/rocky.repo
The mirror list system uses the connecting IP address of the client and the update status of each mirror to pick current mirrors that are geographically close to the client. You should use this for Rocky updates unless you are manually picking other mirrors.
If the mirrorlist does not work for you, you can try the commented out baseurl line instead.
[baseos]
name=Rocky Linux $releasever - BaseOS
mirrorlist=https://mirrors.rockylinux.org/mirrorlist?arch=$basearch&repo=BaseOS-$releasever$rltype
#baseurl=http://dl.rockylinux.org/$contentdir/$releasever/BaseOS/$basearch/os/
gpgcheck=1
enabled=1
countme=1
metadata_expire=6h
gpgkey=file:///etc/pki/rpm-gpg/RPM-GPG-KEY-Rocky-9
#Output truncated for brevity’s sake….
Something you’ll find out in the next section looking at repos is that when they are properly defined they are enabled by default. enabled=1 is implied and doesn’t need to exist when you create a repo.
# Let’s disable a repo and see if the output changes at all
dnf config-manager --disable baseos

# Should now have the line enabled=0 (or false, turned off)
cat /etc/yum.repos.d/rocky.repo

[baseos]
name=Rocky Linux $releasever - BaseOS
mirrorlist=https://mirrors.rockylinux.org/mirrorlist?arch=$basearch&repo=BaseOS-$releasever$rltype
# baseurl=http://dl.rockylinux.org/$contentdir/$releasever/BaseOS/$basearch/os/
gpgcheck=1
enabled=0
countme=1
metadata_expire=6h
gpgkey=file:///etc/pki/rpm-gpg/RPM-GPG-KEY-Rocky-9
# Output truncated for brevity’s sake….

# Re-enable the repo and verify the output
dnf config-manager --enable baseos

# Should now have the line enabled=1 (or true, turned back on)
cat /etc/yum.repos.d/rocky.repo

# Output:
[baseos]
name=Rocky Linux $releasever - BaseOS
mirrorlist=https://mirrors.rockylinux.org/mirrorlist?arch=$basearch&repo=BaseOS-$releasever$rltype
#baseurl=http://dl.rockylinux.org/$contentdir/$releasever/BaseOS/$basearch/os/
gpgcheck=1
enabled=1
countme=1
metadata_expire=6h
gpgkey=file:///etc/pki/rpm-gpg/RPM-GPG-KEY-Rocky-9
# Output truncated for brevity’s sake….
Installing software you were asked by an application team:
So someone has asked for some software and assured you it’s been tested in similar environments, so you go to install it on their system for them.
# See if we already have a version.
rpm -qa mariadb

# See if dnf knows about it
dnf search mariadb
dnf search all mariadb

# What is DNF showing you? What are the differences between these commands based on the output?

# Try to install it
dnf install mariadb
# hit “N”

# Make note of any dependencies that are added on top of mariadb (there’s at least one)
# What does DNF do with the transaction when you cancel it? Can you compare this
# to what you might have used before with YUM? How are they different?
# (You can look it up if you don’t know.)

# Ok, install it
dnf -y install mariadb

# Will just assume yes to everything you say.
# You can also set this option in /etc/dnf/dnf.conf to always assume yes,
# it’s just safer in an enterprise environment to be explicit.
Removing packages with dnf:
Surprise, the user calls back because that install has made the system unstable. They are asking for you to remove it and make the system back to the recent version.
dnf remove mariadb
# hit “N”

# this removes mariadb from your system
dnf -y remove mariadb

# But did this remove those dependencies from earlier?
rpm -q {dependency}
rpm -qi {dependency}

# How are you going to remove that if it’s still there?
# Checking where something came from. What package provides something in your system

# One of the most useful commands dnf provides is the ability to know “what provides”
# something. Sar and iostat are powerful tools for monitoring your system.
# Let’s see how we get them or where they came from, if we already have them.
# Maybe we need to see about a new version to work witha new tool.
dnf whatprovides iostat
dnf whatprovides sar

# Try it on some other tools that you regularly use to see where they come from.
dnf whatprovides systemd
dnf whatprovides ls
dnf whatprovides python

# Using Dnf to update your system or individual packages
# Check for how many packages need update
dnf update

# How many packages are going to update?
# Is one of them the kernel?
# What is the size in MB that is needed?
# Hit “N”

# Your system would have stored those in /var/cache/dnf
# Let’s check to see if we have enough space to hold those
df -h /var/cache/dnf

# Is there more free space than there is needed size in MB from earlier?
# There probably is, but this becomes an issue. You’d be surprised.

# Let’s see how that changes if we exclude the kernel
dnf update --exclude=kernel

# How many packages are going to update?
# Is one of them the kernel?
# What is the size in MB that is needed?
# Hit “N”
You can update your system if you like. You’d have to reboot for your system to take the new kernel. If you do that you can then redo the grubby portion and the ls /boot/ will show the new installed kernel, unless you excluded it.
Using dnf to install group packages:
Maybe we don’t even know what we need to get a project going. We know that we need to have a web server running but we don’t have an expert around to tell us everything that may help to make that stable. We can scour the interwebs (our normal job) but we also have a tool that will give us the base install needed for RHEL or CentOS to run that server.
dnf grouplist
dnf group install development

# How many packages are going to update?
# Is one of them the kernel?
# What is the size in MB that is needed?
# Hit “N”
# Do you see a pattern forming?
If you install this you’re going to have developer tools installed on the server but they won’t be configured. How would you figure out what tools and versions were just installed? How might you report this for your own documentation and to a security team that keeps your security baselines?
Be sure to
rebootthe lab machine from the command line when you are done.
NOTE: This is an optional bonus section. You do not need to read it, but if you're interested in digging deeper, this is for you.
This bonus explores how you can audit and verify software integrity on your system using package tools, hashes, and file validation -- going deeper into real-world sysadmin practice.
This is more of a bonus lab. We're going beyond just installing packages.
We're going to audit, validate, and verify that the software on our system is
trustworthy and unmodified.
We'll explore how to detect unexpected changes using built-in tools, dig into package
metadata, and get a taste of real-world security practices like intrusion detection
and system baselining through package auditing.
In modern enterprise environments, packages may be tampered with, misconfigured, or out-of-date.
A responsible sysadmin needs tools and methods to answer questions like:
- Was this package installed from a trusted source?
- Have any of the installed files been modified?
- Which files belong to which packages?
- Can I detect and recover from unexpected changes?
Let's get into it.
Verifying Package Integrity
Start by finding a package you know is installed and used in your environment -- for example, sshd:
rpm -qi openssh-server
Now, check the integrity of the package's files:
rpm -V openssh-server
-V: Stands for verify.- This option checks timestamps, permissions, ownership, and hashes of installed files.
If you don't see any output, that's a good thing.
rpm -V only reports files that have been altered in some way from what the package database expects.
If there is no output, it means all files match the expected checksums, sizes, permissions, etc..
If this command does have output, being able to interpret the output is important. Each character in the output has its own meaning:
S- Size differs.M- Mode differs (permissions).5- MD5 checksum mismatch.T- Modification time differs.
This is a great way to verify the integrity of installed packages. It's also helpful in troubleshooting when a package isn't working as expected.
Auditing a File in a Package
Let's say you suspect something has been changed or tampered with. Let's get all files from a package.
-
Run
rpm -qlto list the files that were installed with a package:rpm -ql openssh-server -
Now pick one file and manually generate its sha256 hash:
sha256sum /usr/sbin/sshd -
Download the original
.rpmpackage to compare its hash.dnf download openssh-server- This will download the
openssh-server-<version>.rpmpackage in the current directory. - These
.rpmpackages are not stored on the system by default.
- This will download the
-
You can inspect the file of your choice with
rpm -qp --dump:rpm -qp --dump openssh-server*.rpm | grep ^/usr/sbin/sshdThis will output a bunch of information about the file.
Thesha256hash will be in the fourth column, so we can useawkto extract that:rpm -qp --dump openssh-server*.rpm | grep ^/usr/sbin/sshd | awk '{print $4}' -
Compare your version's hash to the original RPM file's hash:
sha256sum /usr/sbin/sshd
If the hashes are different, the file has been modified.
Bonus Challenge 💡
-
Run this one-liner to verify all installed packages:
rpm -Va- This will verify every file from every package and report anything suspicious.
-
Narrow the scope. Only show actual modified files:
rpm -Va | grep -v '^..5'- This removes lines where only the MD5 checksum differs (which could be expected in some config files).
- You’ll now see files where size, mode, owner, or timestamp changed — higher confidence indicators of real change.
-
Investigate a suspicious result. If you see something like:
.M....... c /etc/ssh/sshd_configThat means:
- The permissions (
M) have changed. - It's a config file (
c).
- The permissions (
-
Check the file in question:
ls -l /etc/ssh/sshd_config -
Compare that to what you expected:
rpm -q --qf '%{NAME} %{VERSION}-%{RELEASE}\n' -f /etc/ssh/sshd_config
Then you can reinstall the package or extract the original file from the .rpm file.
Reflection Questions
- What happens if you manually modify a file, then verify with
rpm -V? - Can you identify if changes were made outside of DNF/RPM?
- What types of files are typically most important to verify?
Example of Real-World Security Tools
Large enterprises often use tools like AIDE (Advanced Intrusion Detection Environment) or Tripwire to baseline their systems and detect changes over time.
AIDE can be installed easily with dnf, so you can play around with it if you want.
To set up AIDE on your system (as root):
dnf install aide -y

aide --init

# Copy the default database to use as your database
cp /var/lib/aide/aide.db.new.gz /var/lib/aide/aide.db.gz

# Then, to run a check with aide (this will take a few minutes):
aide --check
AIDE compares the current state of the system to a known baseline.
This is foundational to change management, compliance, and intrusion detection.
Resources
Downloads
Overview
This unit focuses on scripting and system checks in Linux environments, with particular emphasis on bash scripting for system administration tasks. It covers:
-
Bash Scripting Fundamentals: Mastery of shell scripting is essential for automating routine administrative tasks, implementing monitoring solutions, and creating custom tools that enhance system management capabilities.
-
System Monitoring and Checks: Linux administrators must continuously monitor system health, resource utilization, and potential security issues. This unit explores techniques for creating scripts that perform automated system checks, gather performance metrics, and alert administrators to potential problems.
-
Logical Flow and Decision Making: The ability to implement complex decision-making logic in scripts is crucial for handling various system conditions and scenarios. Students will learn to use conditional statements, comparison operators, and truth tables to create intelligent scripts that can adapt to different situations.
-
Automation and Scheduled Tasks: Effective system administration requires automating repetitive tasks and scheduling routine maintenance. This unit covers techniques for creating scripts that can be executed automatically through cron jobs or systemd timers, reducing manual intervention.
Learning Objectives
-
Create and Execute Bash Scripts:
- Develop proficiency in writing and executing bash scripts for system administration tasks.
- Learn to use variables, conditional statements, and loops effectively in scripts.
-
Apply Logical Structures and Decision Making:
- Master the use of if/then/else statements, case statements, and logical operators.
- Understand truth tables and how they apply to script logic.
- Learn to implement complex decision trees that handle multiple conditions.
-
Develop Error Handling and Logging:
- Implement robust error detection and handling in scripts.
- Create comprehensive logging systems that facilitate troubleshooting.
- Design scripts that can recover from common error conditions.
-
Analyze and Improve Script Maintainability:
- Recognize patterns of poor script design and implement improvements.
- Organize code with functions and meaningful variable names.
- Document scripts effectively for future maintenance.
Relevance & Context
The skills taught in this unit are essential for several critical reasons:
-
Efficiency and Automation: In enterprise environments, manual administration of systems is time-consuming and error-prone. Scripting allows administrators to automate routine tasks, significantly reducing the time required and minimizing human error. This automation is particularly valuable for tasks that must be performed consistently across multiple systems.
-
Scalability and Consistency: As infrastructure grows, manual administration becomes increasingly impractical. Scripts enable administrators to implement consistent configurations and perform identical operations across dozens, hundreds, or even thousands of systems simultaneously. This scalability is essential in modern data centers and cloud environments.
-
Knowledge Transfer and Documentation: Scripts serve as executable documentation of system procedures and configurations. When an administrator creates a script to perform a specific task, they are effectively documenting that process in a format that can be shared, reviewed, and executed by others. This facilitates knowledge transfer within teams and ensures operational continuity.
Prerequisites
Before diving into the scripting and system checks covered in this unit, learners should possess the following foundational knowledge and skills:
-
Command-Line Proficiency: A solid understanding of the Linux command line interface is essential. Students should be comfortable navigating the file system, executing commands, and interpreting command output. This includes familiarity with common utilities such as grep, awk, sed, and find.
-
Basic Text Editing Skills: Since scripts are text files, the ability to create and modify text files using editors like vi, vim, nano, or emacs is necessary. Students should be able to open files, make changes, save modifications, and exit editors efficiently.
-
Fundamental Linux System Architecture: An understanding of the Linux file hierarchy, process management, and service control is required. Students should know where configuration files are typically located, how to check system status, and how to start and stop services.
-
Basic Programming Concepts: While this unit will teach scripting from the ground up, familiarity with basic programming concepts such as variables, conditions, loops, and functions will accelerate learning. Students who have experience with any programming language will find these concepts transferable to bash scripting.
Key Terms and Definitions
Bash (Bourne Again Shell)
Script
Variables
Conditional Statements
Loops
Exit Status
Command Substitution
Interpreted Program
Compiled Program
Truth Table
And/Or Logic
Single/Dual/Multiple Alternative Logic
Cron
System Check
Monitoring
Function
Parameter Expansion
Instructions
Fill out the worksheet as you progress through the lab and discussions. Hold your worksheets until the end to turn them in as a final submission packet.
Resources / Important Links
Downloads
The worksheet has been provided below. The document(s) can be transposed to
the desired format so long as the content is preserved. For example, the .txt
could be transposed to a .md file.
Unit 8 Recording
Discussion Post #1
Scenario:
It’s a 2 week holiday in your country and most of the engineers and architects who designed the system are out of town.
You’ve noticed a pattern of logs filling up on a set of web servers from increased traffic. Your research shows, and then you verify, that the logs are being sent off real time to Splunk. Your team has just been deleting the logs every few days, but one of the 3rd shift engineers didn’t read the notes and your team suffered downtime.
How might you implement a simple fix to stop gap the problem before all the engineering resources come back next week?
-
What resources helped you answer this?
-
Why can’t you just make a design fix and add space in /var/log on all these systems?
-
Why can’t you just make a design change and logrotate more often so this doesn’t happen?
-
For 2,3 if you are ok with that, explain your answer. (This isn’t a trick, maybe there is a valid reason.)
Discussion Post #2
Scenario:
You are the only Linux Administrator at a small healthcare company. The engineer/admin before you left you a lot of scripts to untangle. This is one of our many tasks as administrators, so you set out to accomplish it. You start to notice that he only ever uses nested
ifstatements in bash.You also notice that every loop is a conditional
while true, and then he breaks the loop after a decision test each loop. You know his stuff works, but you think it could be more easily written for supportability, for you and future admins. You decide to write up some notes by reading some google, AI, and talking to your peers.
-
Compare the use of nested if versus case statement in bash.
-
Compare the use of conditional and counting loops. Under what circumstances would you use one or the other?
Submit your input by following the link below.
The discussion posts are done in Discord Forums.
Definitions
Variables:
Interpreted program:
Compiled program:
Truth table:
AND/OR logic:
Single/Dual/Multiple alternative logic:
Digging Deeper
- Read:
- https://tldp.org/LDP/Bash-Beginners-Guide/html/sect_07_01.html
- https://tldp.org/LDP/Bash-Beginners-Guide/html/sect_07_02.html
- https://tldp.org/LDP/Bash-Beginners-Guide/html/sect_07_03.html
What did you learn about capabilities of bash that can help you in your scripting?
- If you want to dig more into truth tables and logic, this is a good start: https://en.wikipedia.org/wiki/Truth_table
Reflection Questions
-
What questions do you still have about this week?
-
Just knowing a lot about scripting doesn’t help much against actually doing it in a practical sense. What things are you doing currently at work or in a lab that you can apply some of this logic to?
If you are unable to finish the lab in the ProLUG lab environment we ask you
rebootthe machine from the command line so that other students will have the intended environment.
Resources / Important Links
- Killercoda Labs
- Wikipedia Page for Compilers
- Wikipedia Page for the C Programming Lang
- Wikipedia Page for Truth Table
- CProgramming.com Introductory
- Unit #1 Bonus (VIM) Page
- Unit #8 Bonus (Bash Scripting) Page
Required Materials
- Rocky 9.4+ - ProLUG Lab
- Or comparable Linux box
- root or sudo command access
Downloads
The lab has been provided for convenience below:
Pre-Lab Warm-Up
vi /etc/passwd
# Put a # in front of all your local users you created in a lab a few weeks back
Review how to use vi, if you have a problem getting out or saving your file or use Unit #1 Bonus (Vim) Page to brush up on your Vim Skills.
# Let us locate and inspect the GNU C Compiler Package
rpm -qa | grep -i gcc
dnf whatprovides gcc
dnf search gcc
Check out all the options of different compilers

# Now lets install it
dnf install gcc
# Look at what is going to be installed.

rpm -qi gcc
# Look at this package to see a little about what gcc does
# Repeat steps 2-6 for the software package strace
Compilers
A brief look at compilers and compiling code So we did all this just to show you a quick rundown of how compiled code works on your system. We are going to be doing scripting today, which is not compiled, but rather interpreted code according to a type of interpreter so we’ll just breeze through this part. You can come back and play with this at your leisure, I will provide links for more study.
Let’s write a C program
mkdir c_practice
cd c_practice

#Start a new file with Vi, in this case I am going with 'a'
vi a.c

#Add this to the file:
#include <stdio.h>

main()
{

printf("My first compiled program \n");

return 0;
}
#Let’s use gcc to compile that program
gcc a.c
#This will create a file for you called a.out
#If there is an error, does it still work?

#Alternatively, and more correctly, use this:
gcc -o firstprogram a.c
#Which will create an executable file called first program
ls -salh
#Will show you all your files. Note how big those compiled programs are.
#Execute your programs
./a.out
./firstprogram

#Both of these should do the exact same thing, as they are the same code.
#Watch what your system is doing when you call it via strace
strace ./a.out
strace ./firstprogram
Lab 🧪
Log into your Rocky server and become root.
Module 2.1: Scripting
After all that pre-lab discussion, we won’t be using gcc today—or compiling any programs, for that matter. Instead, we’ll focus on scripting, where we write code that the system interprets and executes step by step. Think of it like reading lines from a play, following sheet music, or executing a script—each command is processed in order.
There are plenty of resources available to learn scripting, but the key to improving is daily practice. If you’re serious about getting better, I recommend studying additional concepts over time. However, to get started, you only need to understand three fundamental ideas:
- Input and Output - How to receive input and where to send the output.
- Conditionals - How to test and evaluate conditions.
- Loops - How to repeat actions efficiently.
2.2 Getting Input
Let’s use examples from our Operate Running Systems lab to see what it looks like to gather system information and store it in variables. Variables in scripting can be thought of as named boxes where we put things we want to look at or compare later. We can, by and large, stuff anything we want into these boxes.
# Try this:

echo $name  # No output
uname
name=`uname`
echo $name

echo $kernel  # No output
uname -r
kernel=`uname -r`
echo $kernel

echo $PATH  # This will have output because it is an environment variable
There will be output because this is one of those special variables that make up your environment variables. You can see them with:
printenv | more
These should not be changed, but if necessary, they can be. If you overwrite any, you can reset them by re-logging into your shell.
We can package things in variables and then reference them by their name preceded by a $.
# Try this to get numerical values from your system for later use in conditional tests.
cat /proc/cpuinfo  # Not very good as a count
cat /proc/cpuinfo | grep -i proc  # Shows processor count but not ideal for testing
cat /proc/cpuinfo | grep -i proc | wc -l  # Outputs a usable number
numProc=`cat /proc/cpuinfo | grep -i proc | wc -l`
echo $numProc

free -m  # Displays memory info
free -m | grep -i mem  # Filters output
free -m | grep -i mem | awk '{print $2}'  # Extracts total memory value
memSize=`free -m | grep -i mem | awk '{print $2}'`
echo $memSize
2.3 Checking Exit Codes
One of the most important inputs in scripting is checking the exit code ($?) of a command. This allows us to determine whether a command succeeded or failed.
ps -ef | grep -i httpd | grep -v grep
echo $?
# Output: 1 (Nothing found, not good "0")

ps -ef | grep -i httpd
root      5514 17748  0 08:46 pts/0    00:00:00 grep --color=auto -i httpd
echo $?
# Output: 0 (Process found, exit code is 0)
Checking for installed packages:
rpm -qa | grep -i superprogram
echo $?
# Output: 1 (Program not found)

rpm -qa | grep -i gcc
libgcc-4.8.5-11.el7.x86_64
gcc-4.8.5-11.el7.x86_64
echo $?
# Output: 0 (GCC is found)
$? only holds the exit status of the last executed command, so store it immediately:
rpm -qa | grep -i superprogram
superCheck=$?

rpm -qa | grep -i gcc
gccCheck=$?

echo $superCheck
echo $gccCheck
2.4 Testing and Evaluating Conditions
2.4.1 Basics of Logic and Truth Tests
I commonly say that “All engineering is the test for truth.” This is not meant as a philosophical statement but a practical one. We take input, verify it, and compare it to our expectations. If it matches, the result is true; otherwise, it is false.
Testing for what something is is much easier than testing for what something is not, as logically, there are infinite possibilities for what something could not be.
Continue exploring these concepts by practicing input handling, storing values in variables, and testing conditions to build efficient scripts.
2.5 Exercise
The Red bunny is tall. We look at our examples and see that this is not true, so the statement evaluates to false.
The Blue bunny is short. We look at our examples and see that this is not true, so the statement evaluates to false.
The Idea of AND and OR
ANDis a restricting test.ORis an inclusive test.
I will prove that here shortly.
ANDingchecks both sides for truth and evaluates to true only ifbothsides are true.ORingallows either side to be true, and the statement still evaluates to true. This makes OR a more inclusive test.
AND Examples
-
The
right bunnyisRedandTall.- This evaluates to
truefor the Red test butfalsefor the Tall test. - The statement evaluates to
false.
- This evaluates to
-
The
left bunnyisBlueandTall.- This evaluates to
truefor the Blue test andtruefor the Tall test. - The statement evaluates to
true.
- This evaluates to
OR Examples
-
The
right bunnyisRedorTall.- This evaluates to
truefor the Red test butfalsefor the Tall test. - The statement evaluates to
true.
- This evaluates to
-
The
left bunnyisRedorShort.- This evaluates to
falsefor Red andfalsefor Short. - The statement evaluates to
false.
- This evaluates to
2.6 - Truth Tables
Google Truth Tables to see engineering diagrams commonly used for testing truth in complex statements.
We will not draw them out in this lab, as there are already well-documented examples. This is a well-known, solved, and understood concept in the engineering world. Instead of reinventing those diagrams, refer to the following link for more details:
2.7 - Flow in a program
- All programs start at the top and run to the bottom. Data never flow back towards the start, unless on a separate path from a decision which always returns to the original path.
When we start thinking about how to lay something out and logically work through it, the idea of a formalized flow chart can help us get a handle on what we're seeing.
Some common symbols you'll see as we go through drawing out our logic. This example creates a loop in the program until some decision evaluates to yes (true).
2.8 - 3 Types of Decisions
There are 3 primary types of decisions you’ll run into with scripting, they are:
SinglealternativeDualalternativeMultiplealternative
2.8.1 - Single Alternative if/then
Single alternatives either occur or they do not. They only branch from the primary path if the condition occurs. They either can or cannot occur, depending on the condition, but compared to alternative paths where a decision must occur if these do not evaluate to true, they are simply passed over.
Evaluate these from earlier and look at the difference.
if [ $superCheck -eq "0" ]; then echo "super exists"; fi
if [ $gccCheck -eq "0" ]; then echo "gcc exists"; fi
You’ll note that only one of them caused any output to come to the screen, the other simply ran and the condition never had to execute.
2.8.2 - Dual alternative (if/then/else)
Dual alternatives forces the code to split. A decision must be made. These are logically if, then, else. We test for a truth, and then, if that condition does not exist we execute the alternative. If you’re a parent or if you ever had a parent, this is the dreaded or else. One of two things is going to happen here, the path splits.
if [ $superCheck -eq "0" ]; then echo "super exists"; else echo "super does not exist"; fi #super does not exist
if [ $gccCheck -eq "0" ]; then echo "gcc exists"; else echo "gcc does not exist"; fi #gcc exists
2.8.3 - Multiple Alternative (if/then/elif/…/else or Case)
Multiple alternatives provide a branch for any numbers of ways that a program can go. They can be structured as if, then, else if elif in bash, else. They can also be framed in the case statement, which can select any number of cases (like doors) that can be selected from. There should always be a default else value for case statements, that is to say, if one of the many conditions don’t exist there is something that happens anyways (*) in case statements.
superCheck=4
if [ $superCheck -eq "0" ]; then echo "super exists"; elif [ $superCheck -gt "1" ]; then echo "something is really wrong"; else echo "super does not exist"; fi
gccCheck=5
if [ $gccCheck -eq "0" ]; then echo "gcc exists"; elif [ $gccCheck -gt "1" ]; then echo "something is really wrong"; else echo "gcc does not exist"; fi
Set those variables to the conditions of 0, 1, and anything else to see what happens.
Think about why greater than 1 does not hit the condition of 1. Might it be easier to think of as greater than or equal to 2? Here’s a list of things you can test against. http://tldp.org/LDP/abs/html/tests.html
Also a huge concept we don’t have a lot of time to cover is found here: File test operators http://tldp.org/LDP/abs/html/fto.html, do files exist and can you do operating system level things with them?
We didn’t get to go into case, but they are pretty straight forward with the following examples: http://tldp.org/LDP/Bash-Beginners-Guide/html/sect_07_03.html
We didn’t get to explore these much earlier, but to test AND and OR functionality use this.
AND condition
if [ $gccCheck -eq "0" -a $superCheck -eq "1" ]; then echo "We can install someprogram"; else echo "We can't install someprogram"; fi
We can't install someprogram
OR condition
if [ $gccCheck -eq "0" -o $superCheck -eq "1" ]; then echo "We can install someprogram"; else echo "We can't install someprogram"; fi
We can't install someprogram
2.8.4 - Looping around
As with everything today, this is simply a primer and there are hundreds to thousands of examples online a simple google away. There are only two types of loops; counting loops and conditional loops. At the most basic level, we use counting loops when we (or the system) know how many times we want to go through something. Some examples of this are actual hard counts, lists, or lengths of files typically by line. While loops will continue until a condition exists or stops existing. The difference is until that condition occurs there’s no reasonable way of knowing how many times the loop may have to occur.
For loops
Counting is iteration.
We can count numbers
for i in 1 2 3 4 5; do echo "the value now is $i"; done
We can count items
for dessert in pie cake icecream sugar soda; do echo "this is my favorite $dessert"; done
But, it’s impractical to count for ourselves sometimes so we let the system do it for us.
seq 100 \
seq 4 100 \
seq 6 2 100 \
man seq
What did each of those do? Let’s put them in a loop we can use
Maybe we want to count our 1000 servers and connect to them by name.
for i in `seq 1000`; do echo "Connecting to server p01awl$i"; done
Maybe we need to create a list of all our servers and put it in a list
for i in `seq 1000`; do echo "p01awl$i" >> serverfile; done
Maybe someone else gave us a list of servers and we need to read from that list to connect and do work.
for server in `cat serverfile`; do echo "connecting to server $server"; done
So, while those are even just a limited set of cases those are all times when, at the start, we know how many times we’re going to go through the loop. Counting or For loops always have a set number of times they’re going to run. That can change, but when it starts the end number of runs is known.
While loops
While loops are going to test conditions and loop while that condition evaluates to true. We can invert that, as we can with all logic, but I find that testing for truth is always easiest.
It is important to remember that CRTL + C will break you out of loops, as that will come handy here.
Administrators often find themselves looking at data and needing to refresh that data. One of the simplest loops is an infinite loop that always tests the condition of true (which always evaluates to true) and then goes around again. This is especially useful when watching systems for capacity issues during daemon or program startups.
while true; do date; free -m; uptime; sleep 2; done
This will run until you break it with CTRL + C. This will loop over the date, free -m, uptime, and sleep 2 commands until the condition evaluates to false, which it will never do.
Let’s run something where we actually have a counter and see what that output is
counter=0
while [[ $counter -lt 100 ]]; do echo "counter is at $counter"; (( counter++ )); done
What numbers were counted through?
If you immediately run this again, what happens? Why didn’t anything happen?
#Reset counter to 0
counter=0
Re-run the above loop. Why did it work this time?
Reset the counter and run it again. Try moving the counter to before the output. Can you make it count from 1 to 100? Can you make it count from 3 to 251? Are there challenges to getting that to work properly?
What if we wanted something to happen for every MB of free RAM on our system? Could we do that?
memFree=`free -m | grep -i mem | awk '{print $2}'`
counter=0
while [[ $counter -lt $memFree ]]; do echo "counter is at $counter"; (( counter++ )); done
3.0 - Scripting System Checks
The main thing we haven’t covered is what to actually do with these things we’ve done. We can put them into a file and then execute them sequentially until the file is done executing. To do that we need to know the interpreter (bash is default) and then what we want to do.
touch scriptfile.sh
chmod 755 scriptfile.sh #let’s just make it executable now and save trouble later
vi scriptfile.sh
add the following lines:
#!/bin/bash

echo "checking system requirements"

rpm -qa | grep -i gcc > /dev/null
gccCheck=$?

rpm -qa | grep -i superprogram > /dev/null
superCheck=$?

if [ $gccCheck -eq "0" -a $superCheck -eq "1" ]
  then echo "We can install someprogram"
else
  echo "We can't install someprogram"
fi
Execute this with the following command and you’ll have your first completed script.
./scriptfile.sh
run the strace command to see what is happening with your system when it interprets this script.
strace ./scriptfile.sh
That's a lot of output! Now try adding -c for a summary. Here you can see all the syscalls made by the script and the time is took for each one.
strace -c ./scriptfile.sh
There are a lot of ways to use these tools. There are a lot of things you can do and include with scripts. This is just meant to teach you the basics and give you some confidence that you can go out there and figure out the rest. You can develop things that solve your own problems or automate your own tasks.
NOTE: This is an optional bonus section. You do not need to read it, but if you're interested in digging deeper, this is for you.
Bash: The Essential Skill for Any Linux Administrator
If you're planning to work with Linux, you’ll use Bash every day -- whether troubleshooting servers, automating tasks, or managing system configurations.
Why is bash important?
- Bash is everywhere:
- Bash is the default shell on all major Linux distributions (RedHat, Debian, etc), and most other distributions
- It automates common sysadmin tasks (backups, log analysis, deployments)
- Bash is essential for DevOps and administrative workflows (writing scripts, configuring CI/CD pipelines).
Why learn Bash?
- You can automate repetitive or complex tasks.
- You can manage anything on your system using Bash (files, processes, services, etc.).
- Bash works across almost all major Linux distributions.
Bash scripting turns manual commands into powerful, reusable automation.
Writing Your First Script
Let's create a simple script that prints a message.
-
Create a script file:
touch first-script.sh -
Make it executable:
chmod +x first-script.sh # Or, use octal chmod 755 first-script.sh -
Open it in a text editor (e.g.,
vi):vi first-script.sh -
Add the following code:
#!/bin/bash echo "Hello, admin!" -
Run the script:
./first-script.sh -
Expected output:
Hello, admin! -
Key Takeaways:
- The
#!/bin/bashshebang line tells the system which interpreter to use to execute the script. chmod +xorchmod 755makes the script executable../is required because the script is not in the system’sPATH.
- The
It's worth noting that including a .sh file extension is completely optional.
If you decide to replace the Bash script with an executable binary down the line,
having a .sh file extension can hurt you (e.g., if any other programs try to
execute it using the .sh filename).
10 Common Control Operators
These operators allow you to chain and control command execution in Bash.
| Operator | Purpose | Example |
|---|---|---|
; | Run multiple commands sequentially | mkdir test; cd test |
&& | Run second command only if first succeeds | mkdir test && cd test |
|| | Run second command only if first fails | mkdir test || echo "Failed" |
& | Run a command in the background | sleep 60 & |
| | Pipe output from one command to another | ls | grep ".txt" |
() | Run commands in a subshell | (cd /tmp && ls) |
{} | Run commands in the current shell | { cd /tmp; ls; } |
> | Redirect output to a file (overwrite) | echo "log" > file.txt |
>> | Redirect output (append) | echo "log" >> file.txt |
$(...) | Capture command output (from a subshell) | DATE=$(date) |
- Why does this matter?
- These operators control execution flow and are fundamental to Bash scripting.
10 Common Conditionals
Bash conditionals allow scripts to make decisions.
| Test | Meaning | Example |
|---|---|---|
[[ -f FILE ]] | File exists | [[ -f /etc/passwd ]] |
[[ -d DIR ]] | Directory exists | [[ -d /home/user ]] |
[[ -n STR ]] | String is non-empty | [[ -n "$USER" ]] |
[[ -z STR ]] | String is empty | [[ -z "$VAR" ]] |
[[ "$A" = "$B" ]] | Strings are equal | [[ "$USER" = "root" ]] |
[[ "$A" != "$B" ]] | Strings are not equal | [[ "$USER" != "admin" ]] |
[[ NUM1 -eq NUM2 ]] | Numbers are equal | [[ 5 -eq 5 ]] |
[[ NUM1 -gt NUM2 ]] | NUM1 is greater than NUM2 | [[ 10 -gt 5 ]] |
[[ "$?" -eq 0 ]] | Last command was successful | command && echo "Success" |
[[ -x FILE ]] | File is executable | [[ -x script.sh ]] |
-
Why does this matter?
- These tests are used in
if-statements and loops.
- These tests are used in
-
Single brackets vs. double brackets?
- Single brackets
[ ... ]are used in POSIX shell scripts. Using single brackets is equivalent to using thetestcommand (seehelp testandhelp [)- These are generally more subject to shell injection attacks, since they allow anything to expand within them.
- You must quote all variables and subshell command (i.e.,
"$(...)") within single brackets.
- Double brackets
[[ ... ]]are keywords (also builtins) in bash (seehelp [[).- These do not require you to quote variables, and provide some extended functionality.
- If you're writing a Bash script, there's no reason to use single brackets for conditionals.
- Single brackets
10 Bash Scripting Scenarios
Below are 10 real-world examples of using bash from the command line.
| Scenario | Solution | Cont'd. |
|---|---|---|
| Check if a file exists before deleting | if [ -f "data.txt" ]; then rm data.txt; fi | |
| Backup a file before modifying | cp config.conf config.bak | |
| Create a log entry every hour | echo "$(date): Check OK" >> log.txt | |
| Monitor disk space | df -h | awk '$5 > 90 {print "Low disk: "$1}' |
| Check if a service is running | systemctl is-active nginx | systemctl restart nginx |
| List large files in a directory | find /var/log -size +100M -exec ls -lh {} \; | |
Change all .txt files to .bak | for file in *.txt; do mv "$file" "${file%.txt}.bak"; done | |
| Check if a user is logged in | who | grep "admin" |
| Kill a process by name | pkill -f "python server.py" | |
| Find and replace text in files | sed -i 's/old/new/g' file.txt |
- Why does this matter?
- These scenarios show how Bash automates real-world tasks.
Debugging Bash Scripts
Debugging tools help troubleshoot Bash scripts.
| Command | Purpose |
|---|---|
set -x | Print each command before execution |
set -e | Exit script if any command fails |
trap '...' ERR | Run a custom error handler when a command fails |
echo "$VAR" | Print variable values for debugging |
printf "%s\n" "$VAR" | Print variable values for debugging |
bash -x script.sh | Run script with debugging enabled |
Using set -x and echo (or printf) are some of the most common methods of
troubleshooting.
Example Debugging Script
#!/bin/bash
set -xe  # Enable debugging and exit on failure
mkdir /tmp/mydir
cd /tmp/mydir
rm -rf /tmp/mydir
Next Steps
Now that you understand the fundamentals, here’s what to do next:
- Practice writing scripts:
- Automate a daily task (e.g., installing a program, creating backups, user management)
- Master error handling:
- Learn signals and
trap, and learn about logging techniques.
- Learn signals and
- Explore advanced topics:
- Look into writing functions, using arrays, and job control.
- Read
man bash:- The ultimate built-in reference.
- This resource has everything you need to know about Bash and then some!
- Join ProLUG community:
- Learn from others, contribute, and improve your Linux skillset.
🚀 Happy scripting!
Downloads
Overview
In this unit, we dive into the modern world of containerization, focusing on Podman—an open-source, daemon-less container engine. As Linux administrators, understanding containerization is crucial for supporting developers, managing production systems, and deploying services efficiently.
We’ll explore what containers are, how to manage them, and how to build container images.
Relevance & Context
Containerization is a critical part of modern IT, powering development pipelines (CI/CD), cloud deployments, and microservices. As Linux system administrators, we are expected to support and troubleshoot containers, manage container infrastructure, and ensure smooth operations across development and production environments.
This unit focuses on Podman, a secure, rootless, and daemon-less alternative to Docker, widely used in enterprise environments like Red Hat and Rocky Linux. Whether you work in a NOC, DevOps, or traditional SysAdmin role, understanding containerization is essential to being an effective part of any IT team.
Learning Objectives
By the end of this unit, you will be able to:
- Explain what containers are and how they fit into modern Linux system administration
- Run and manage Podman containers, including starting, stopping, and inspecting containers
- Build custom container images using Dockerfiles and Podman
- Analyze container processes, logs, and network interactions for troubleshooting
Prerequisites
Before starting Unit 9, you should have:
- Basic understanding of Linux command line and shell operations
- Familiarity with package management and system services on RHEL-based systems (Rocky/Red Hat)
- Root or sudo access to a Linux system (Rocky 9 or equivalent)
- Completed previous units on system administration fundamentals (file permissions, processes, networking)
- Optional but recommended: Initial exposure to virtualization or application deployment concepts
Key Terms and Definitions
Containers
Virtual Machines
Podman
Images
Dockerfiles
Virtualization
Daemon-less
Instructions
Fill out the worksheet as you progress through the lab and discussions. Hold your worksheets until the end to turn them in as a final submission packet.
Resources / Important Links
Downloads
The worksheet has been provided below. The document(s) can be transposed to
the desired format so long as the content is preserved. For example, the .txt
could be transposed to a .md file.
Unit 9 Recording
Discussion Post #1
It’s a slow day in the NOC and you have heard that a new system of container deployments are being used by your developers. Do some reading about containers, docker, and podman.
-
What resources helped you answer this?
-
What did you learn about that you didn’t know before?
-
What seems to be the major benefit of containers?
-
What seems to be some obstacles to container deployment?
Discussion Post #2
Scenario:
You get your first ticket about a problem with containers. One of the engineers is trying to move his container up to the Dev environment shared server. He sends you over this information about the command he’s trying to run.
[developer1@devserver read]$ podman ps
CONTAINER ID  IMAGE       COMMAND     CREATED     STATUS      PORTS       NAMES
[developer1@devserver read]$ podman images
REPOSITORY                TAG                IMAGE ID      CREATED      SIZE
localhost/read_docker     latest             2c0728a1f483  5 days ago   68.2 MB
docker.io/library/python  3.13.0-alpine3.19  9edd75ff93ac  3 weeks ago  47.5 MB
[developer1@devserver read]$ podman run -dt -p 8080:80/tcp docker.io/library/httpd
You decide to check out the server
[developer1@devserver read] ss -ntulp
Netid   State    Recv-Q   Send-Q      Local Address:Port        Peer Address:Port         Process
udp     UNCONN   0        0           127.0.0.53%lo:53               0.0.0.0:*             users:(("systemd-resolve",pid=166693,fd=13))
tcp     LISTEN   0        80              127.0.0.1:3306             0.0.0.0:*             users:(("mariadbd",pid=234918,fd=20))
tcp     LISTEN   0        128               0.0.0.0:22               0.0.0.0:*             users:(("sshd",pid=166657,fd=3))
tcp     LISTEN   0        4096        127.0.0.53%lo:53               0.0.0.0:*             users:(("systemd-resolve",pid=166693,fd=14))
tcp     LISTEN   0        4096                    *:8080                   *:*             users:(("node_exporter",pid=662,fd=3))
-
What do you think the problem might be?
- How will you test this?
-
The developer tells you that he’s pulling a local image. Do you find this to be true, or is something else happening in their
runcommand?
Submit your input by following the link below.
The discussion posts are done in Discord Forums.
Definitions
Container:
Docker:
Podman:
CI/CD:
Dev/Prod Environments (Development/Production Environments):
Dockerfile:
Docker/Podman images:
Repository:
Digging Deeper
-
Find a blog on deployment of some service or application in a container that interests you.
See if you can get the deployment working in the lab.- What worked well?
- What did you have to troubleshoot?
- What documentation can you make to be able to do this faster next time?
-
Run this scenario and play with K3s: https://killercoda.com/k3s/scenario/intro
Reflection Questions
-
What questions do you still have about this week?
-
How can you apply this now in your current role in IT? If you’re not in IT, how can you look to put something like this into your resume or portfolio?
If you are unable to finish the lab in the ProLUG lab environment we ask you
rebootthe machine from the command line so that other students will have the intended environment.
Resources / Important Links
- Killercoda Labs
- https://podman.io/docs
- https://docs.docker.com/build/concepts/dockerfile/
- https://docs.podman.io/en/latest/markdown/podman-exec.1.html
Required Materials
- Rocky 9.4+ - ProLUG Lab
- Or comparable Linux box
- root or sudo command access
Downloads
The lab has been provided for convenience below:
Pre-Lab Warmup
-
which podman -
dnf whatprovides podman -
rpm -qi podman
When was this installed?
What version is it?
Why might this be important to know? -
podman images -
podman ps
What do you learn from those two commands?
Why might it be important to know on a system?
Lab 🧪
Building and running containers
Your tasks in this lab are designed to get you thinking about how container deployments interact with our Linux systems that we support.
- Pull and run a container
podman run -dt -p 8080:80/tcp docker.io/library/httpd
What do you see on your screen as this happens?
- Check your images again (from your earlier exercises)
podman images
Is there a new image, and if so, what do you notice about it?
- Check your podman running containers
podman ps
What appears to be happening? Can you validate this with your Linux knowledge?
ss -ntulp
curl 127.0.0.1:8080
- Inspect the running pod
podman inspect -l
What format is the output in?
What important information might you want from this in the future?
podman logs -l
What info do you see in the logs?
Do you see your connection attempt from earlier? What is the return code and
why is that important for troubleshooting?
podman top -l
What processes is the pod running?
What other useful information might you find here?
Why might it be good to know the user being run within the pod?
- Stop the pod by its name
podman stop <podname>
Can you verify it is stopped from your previous commands?
podman ps
ss -ntulp
curl 127.0.0.1:8080
Does the container still exist? Why might you want to know this?
podman image
Build an application in a container
The ProLUG lab will already have a version of this setup for you to copy and run. If you are in a different environment, follow https://docs.docker.com/build/concepts/dockerfile/ for the general same steps.
- Setup your lab environment
[root@rocky11 stream]# cd /lab_work/
[root@rocky11 lab_work]# ls
[root@rocky11 lab_work]# mkdir scott_lab9
[root@rocky11 lab_work]# cd scott_lab9/
[root@rocky11 scott_lab9]# ls
[root@rocky11 scott_lab9]# cp /labs/lab9.tar.gz .
[root@rocky11 scott_lab9]# tar -xzvf lab9.tar.gz
lab9/
lab9/Dockerfile
lab9/hello.py
[root@rocky11 scott_lab9]# ls
lab9 lab9.tar.gz
[root@rocky11 scott_lab9]# cd lab9
[root@rocky11 lab9]# pwd
/lab_work/scott_lab9/lab9
[root@rocky11 lab9]# ls
Dockerfile hello.py
- Create a docker image from the docker file:
time podman build -t scott_hello .
#Use your name
What output to your screen do you see as you build this?
Approximately how long did it take?
If this breaks in the lab, how might you fix it? What do you suspect?
- Verify that you have built the container
podman images
- Run the container as a daemon
podman run -dt localhost/scott_example
- Verify the name and that it is running
podman ps
- Exec into the pod and see that you are on the Ubuntu container
podman exec -it festive_pascal sh
cat /etc/*release
exit
Conclusion
There are a lot of ways to use these tools. There are a lot of ways you will support them. At the end of the day you're a Linux System Administrator, you're expected to understand everything that goes on in your system. To this end, we want to know the build process and run processes so we can help the engineers we support keep working in a Linux environment.
Be sure to
rebootthe lab machine from the command line when you are done.
Overview
This unit introduces Kubernetes (K8s), an open-source container orchestration platform that automates the deployment, scaling, and management of containerized applications. The unit covers:
- Understanding Kubernetes Architecture - Nodes, Control Plane, and Cluster Components.
- Installing K3s - A lightweight Kubernetes distribution optimized for resource efficiency.
- Interacting with Kubernetes - Using
kubectlto manage and troubleshoot clusters. - Deploying Applications - Creating and managing Pods, Deployments, and Services.
- Security and Best Practices - Implementing security measures and troubleshooting issues.
Kubernetes plays a critical role in modern enterprise infrastructure, enabling scalability, high availability, and automation in cloud-native applications.
Learning Objectives
By the end of this unit, learners will:
-
Understand the Core Concepts of Kubernetes:
- Define Kubernetes and explain its role in container orchestration.
- Differentiate between Kubernetes vs. PaaS (Platform as a Service).
-
Deploy and Manage Kubernetes Clusters:
- Install K3s and verify its functionality.
- Manage cluster resources using
kubectl.
-
Perform Basic Kubernetes Operations:
- Create and manage Pods, Deployments, and Services.
- Understand the role of Namespaces, ConfigMaps, and Secrets.
-
Troubleshoot Kubernetes Clusters:
- Identify common cluster issues and validate node status.
- Diagnose networking and pod scheduling problems.
-
Apply Security Best Practices in Kubernetes:
- Secure containerized applications using best practices.
- Implement Kubernetes Pod Security Standards.
Relevance & Context
Kubernetes is a foundational technology in modern DevOps and cloud computing. Understanding it is critical for system administrators, DevOps engineers, and site reliability engineers (SREs) for several reasons:
- Scalability & Automation - Automates containerized application deployments, scaling, and management.
- Resource Efficiency - Optimizes workload distribution across multiple nodes.
- Infrastructure as Code (IaC) - Kubernetes configurations can be defined declaratively using YAML.
- Cross-Cloud Compatibility - Supports deployment across on-premises, hybrid, and multi-cloud environments.
- High Availability & Self-Healing - Detects and replaces failed instances automatically.
Prerequisites
Before beginning this unit, learners should have:
- A working knowledge of Linux system administration.
- Experience using the command line (
bash,ssh,vim). - Familiarity with containers and tools like Docker.
- Basic networking knowledge, including IP addressing and port management.
Key Terms and Definitions
Kubernetes (K8s)
K3s
Control Plane
Nodes
Pods
Deployments
Services
Kubelet
Scheduler
ETCD
Kube-proxy
Static Pod
Instructions
Fill out the worksheet as you progress through the lab and discussions. Hold your worksheets until the end to turn them in as a final submission packet.
Resources / Important Links
- Kubernetes Overview
- K3s Official Documentation
- Kubernetes Security Best Practices
- Pod Security Standards
- Interactive Kubernetes Labs
Downloads
The worksheet has been provided below. The document(s) can be transposed to
the desired format so long as the content is preserved. For example, the .txt
could be transposed to a .md file.
Unit 10 Recording
Discussion Post #1
Read: Kubernetes Overview
-
What are the two most compelling reasons to implement Kubernetes in your organization?
-
The article states that Kubernetes is not a PaaS. What does that mean? How does Kubernetes compare to a traditional PaaS?
Discussion Post #2
Scenario:
Your team is troubleshooting a Kubernetes cluster where applications are failing to deploy. They send you the following output:
[root@Test_Cluster1 ~]# kubectl version
Client Version: v1.31.6+k3s3
Kustomize Version: v5.0.4-0.20230601165947-6ce0bf390ce3
Server Version: v1.30.6+k3s1

[root@rocky15 ~]# kubectl get nodes
NAME            STATUS      ROLES                  AGE   VERSION
Test_Cluster1   Ready       control-plane,master   17h   v1.30.6+k3s1
Test_Cluster2   NotReady    worker                 33m   v1.29.6+k3s1
Test_Cluster3   Ready       worker                 17h   v1.28.6+k3s1
-
How would you validate the error?
-
What do you suspect is causing the problem?
-
Has someone already attempted to fix this problem? Why or why not?
Discussion Post #3
Scenario:
You are the Network Operations Center (NOC) lead, and your team is responsible for monitoring development, test, and QA Kubernetes clusters.
Write a basic cluster health check procedure for new NOC personnel.
-
What online resources did you use to figure this out?
-
What did you learn during this process?
Submit your input by following the link below.
The discussion posts are done in Discord Forums.
Key Terminology & Definitions
Define the following Kubernetes terms:
-
Kubernetes/K8s:
-
K3s:
-
Control Plane:
-
Node:
-
Pod:
-
Deployment:
-
Service:
-
ETCD:
-
Kubelet:
-
Kube-proxy:
-
Scheduler:
-
API Server:
Lab and Assignment
Unit 10 Lab k3s
Continue working on your project from the Project Guide
Topics:
- System Stability
- System Performance
- System Security
- System monitoring
- Kubernetes
- Programming/Automation You will research, design, deploy, and document a system that improves your administration of Linux systems in some way.
Digging Deeper
-
Build a custom container and deploy it in Kubernetes securely.
-
Read about container security:
-
Complete this Kubernetes security lab:
Reflection Questions
-
What questions do you still have about Kubernetes?
-
How can you apply this knowledge in your current IT role?
-
If you’re not in IT, how could this experience contribute to your resume or portfolio?
If you are unable to finish the lab in the ProLUG lab environment we ask you
rebootthe machine from the command line so that other students will have the intended environment.
Resources / Important Links
- Killercoda Labs
- Kubernetes Documentation
- K3s Official Site
- Pod Security Standards
- Kubernetes Troubleshooting Guide
Required Materials
- Rocky 9.4+ - ProLUG Lab
- Or comparable Linux box
- root or sudo command access
Downloads
The lab has been provided for convenience below:
Pre-Lab: Quick Warmup and System Checks
Before installing K3s, verify system compatibility and gather initial data.
Step 1: Download and Inspect K3s Installer
curl -sfL https://get.k3s.io > /tmp/k3_installer.sh
more /tmp/k3_installer.sh
Questions:
- What system checks does the installer perform?
- What environment variables does it check?
Step 2: System Architecture Check
uname -m
grep -i arch /tmp/k3_installer.sh
Questions:
- What is the variable holding the system architecture?
- How does K3s determine system compatibility?
Step 3: SELinux Status Check
grep -iE "selinux|sestatus" /tmp/k3_installer.sh
sestatus
Questions:
- Does K3s check if SELinux is enabled?
- What are the implications of SELinux on Kubernetes deployments?
Installing K3s and Verifying the Service
Step 4: Install K3s
curl -sfL https://get.k3s.io | sh -
Step 5: Verify Installation
systemctl status k3s
systemctl is-enabled k3s
- What files and services were installed?
- Is K3s set to start on boot?
Step 6: Explore System Services
systemctl cat k3s
- What startup configurations does K3s have?
- Does it rely on any dependencies?
Exploring Kubernetes Environment
Step 7: Checking Kubernetes Components
kubectl version
kubectl get nodes
kubectl get pods -A
kubectl get namespaces
kubectl get configmaps -A
kubectl get secrets -A
Questions:
- What namespaces exist by default?
- What secrets are stored in the cluster?
Deploying Applications: Pods, Services, and Deployments
Step 8: Create a Simple Web Server Pod
kubectl run webpage --image=nginx
- Verify pod creation:
kubectl get pods
kubectl describe pod webpage
Step 9: Deploy a Redis Database with Labels
kubectl run database --image=redis --labels=tier=database
- Verify labels:
kubectl get pods --show-labels
Step 10: Expose the Redis Database
kubectl expose pod database --port=6379 --name=redis-service --type=ClusterIP
- Verify service:
kubectl get services
Step 11: Create a Web Deployment with Replicas
kubectl create deployment web-deployment --image=nginx --replicas=3
- Check status:
kubectl get deployments
Step 12: Create a New Namespace and Deploy an App
kubectl create namespace my-test
kubectl create deployment redis-deploy -n my-test --image=redis --replicas=2
- Verify deployment:
kubectl get pods -n my-test
Troubleshooting Cluster Issues
Your team reports an issue with the cluster:
[root@Test_Cluster1 ~]# kubectl get nodes
NAME            STATUS      ROLES                AGE     VERSION
Test_Cluster1   Ready       control-plane,master 17h     v1.30.6+k3s1
Test_Cluster2   NotReady    worker               33m     v1.29.6+k3s1
Test_Cluster3   Ready       worker               17h     v1.28.6+k3s1
Step 13: Investigate Node Health
kubectl describe node Test_Cluster2
kubectl get pods -A
- What errors do you notice?
- Is there a resource constraint or version mismatch?
Step 14: Restart K3s and Check Logs
systemctl restart k3s
journalctl -xeu k3s
- What errors appear in the logs?
- Does restarting resolve the issue?
Conclusion
At the end of this lab, you should:
✅ Have a fully operational K3s Kubernetes cluster.
✅ Be able to deploy and expose containerized applications.
✅ Know how to troubleshoot common Kubernetes errors.
✅ Understand security best practices for Kubernetes deployments.
📌 Next Steps: Continue testing deployments, set up monitoring tools like Prometheus or Grafana, and explore Ingress Controllers to manage external access.
Be sure to
rebootthe lab machine from the command line when you are done.
NOTE: This is an optional bonus section. You do not need to read it, but if you're interested in digging deeper, this is for you.
This section provides advanced troubleshooting techniques, security best practices, and real-world challenges to strengthen your Kubernetes knowledge.
Step 1: Troubleshooting Kubernetes Cluster Issues
When things go wrong, systematic troubleshooting is key. Here’s how you diagnose common Kubernetes issues.
Node Not Ready
Check node status
kubectl get nodes
kubectl describe node <node-name>
Investigate Kubelet logs
journalctl -u k3s -n 50 --no-pager
Verify system resources
free -m     # Check available memory
df -h       # Check disk space
htop        # Monitor CPU usage
Possible Fixes
- Restart K3s on the failing node:
systemctl restart k3s - Ensure network connectivity:
ping <control-plane-ip>
Pods Stuck in "Pending" or "CrashLoopBackOff"
Check pod status
kubectl get pods -A
kubectl describe pod <pod-name>
kubectl logs <pod-name>
Possible Fixes
- If insufficient resources, scale up the cluster.
- If missing images, check container registry authentication.
- If misconfigured storage, inspect volumes:
kubectl get pvc
Step 2: Securing Kubernetes Deployments
Security is crucial in enterprise environments. Here are quick wins for a more secure Kubernetes cluster.
Limit Pod Privileges
Disable privileged containers
securityContext:
  privileged: false
Enforce read-only file system
securityContext:
  readOnlyRootFilesystem: true
Restrict Network Access
Use Network Policies to restrict pod communication
apiVersion: networking.k8s.io/v1
kind: NetworkPolicy
metadata:
  name: deny-all
spec:
  podSelector: {}
  policyTypes:
    - Ingress
Use NetworkPolicy Editor to create and edit your network policies.
Use Pod Security Admission (PSA)
Enable PSA to enforce security levels:
kubectl label --overwrite ns my-namespace pod-security.kubernetes.io/enforce=restricted
Step 3: Performance Optimization Tips
Enhance Kubernetes efficiency with these quick optimizations:
Optimize Resource Requests & Limits
Set appropriate CPU & Memory limits in deployments:
resources:
  requests:
    cpu: "250m"
    memory: "256Mi"
  limits:
    cpu: "500m"
    memory: "512Mi"
Why? Prevents a single pod from consuming excessive resources.
Enable Horizontal Pod Autoscaling (HPA)
Auto-scale pods based on CPU or memory usage:
kubectl autoscale deployment my-app --cpu-percent=50 --min=2 --max=10
Step 4: Bonus Challenge - Build a Secure, Scalable App
Challenge:
- Create a secure containerized app
- Deploy it in Kubernetes
- Implement Network Policies
- Apply Pod Security Standards
Helpful Resources:
Conclusion
This bonus section strengthens your Kubernetes troubleshooting, security, and performance tuning skills. Apply these principles in real-world deployments!
Downloads
Overview
In this unit, we focus on Linux system monitoring, using modern tools like Grafana, Prometheus, Node Exporter, and Loki. As Linux administrators, monitoring is essential to ensure system stability, performance, and security across environments.
We will explore how to collect, analyze, and visualize system metrics, and discuss best practices for monitoring and dashboard design that can improve troubleshooting and proactive system management.
Learning Objectives
By the end of this unit, you will be able to:
- Explain core monitoring concepts like metrics, logs, SLOs, SLIs, and KPIs
- Set up Prometheus and Node Exporter to collect system metrics
- Use Grafana to create dashboards for visualizing system health and performance
- Write and execute PromQL queries to analyze system data
- Interpret monitoring data to diagnose system issues and support teams with actionable insights
Relevance & Context
Monitoring is a core responsibility of Linux system administration, ensuring you know what’s happening under the hood before issues escalate. Modern IT environments rely on monitoring to track system performance, security events, and overall stability — whether in production, development, or cloud environments.
This unit focuses on Grafana for visualization and Prometheus with Node Exporter for telemetry and metrics collection — tools commonly used in enterprise, cloud, and HPC (High-Performance Computing) environments.
Whether you're in a NOC, SysAdmin, or DevOps role, understanding monitoring and telemetry makes you a key contributor to system reliability and performance.
Prerequisites
Before starting Unit 11, you should have:
- Basic understanding of Linux system administration and networking
- Familiarity with system processes, performance metrics, and logs
- Root or sudo access to a Linux system (Rocky 9 or equivalent)
- Internet access to run labs via Killercoda and online resources
- (Optional but recommended): Exposure to containers and services like Grafana or Prometheus
Key Terms and Definitions
SLO (Service Level Objective)
SLA (Service Level Agreement)
SLI (Service Level Indicator)
KPI (Key Performance Indicator)
MTTD (Mean Time to Detect)
MTTR (Mean Time to Repair)
Instructions
Fill out the worksheet as you progress through the lab and discussions. Hold your worksheets until the end to turn them in as a final submission packet.
Resources / Important Links
- How to easily monitor your Linux server | Grafana Labs
- 30 Linux System Monitoring Tools Every SysAdmin Should Know
- Monitoring Linux Using SNMP - Nagios
Downloads
The worksheet has been provided below. The document(s) can be transposed to
the desired format so long as the content is preserved. For example, the .txt
could be transposed to a .md file.
Unit 11 Recording
Discussion Post #1
You’ve heard the term “loose coupling” thrown around the office about a new monitoring solution coming down the pike. You find a good resource and read the section on “Prefer Loose Coupling” https://sre.google/workbook/monitoring/.
-
What does “loose coupling” mean, if you had to summarize to your junior team members?
-
What is the advantage given for why you might want to implement this type of tooling in your monitoring? Do you agree? Why or why not?
-
They mention “exposing metrics” what does it mean to expose metrics? What happens to metrics that are exposed but never collected?
Discussion Post #2
Your HPC team is asking for more information about how CPU0 is behaving on a set of servers. Your team has node exporter writing data out to Prometheus (Use this to simulate https://promlabs.com/promql-cheat-sheet/).
-
Can you see the usage of CPU0 and what is the query?
-
Can you see the usage of CPU0 for just the last 5 minutes and what is the query?
-
You know that CPU0 is excluded from Slurm, can you exclude that and only pull the user and system for the remaining CPUs and what is that query?
Submit your input by following the link below.
The discussion posts are done in Discord Forums.
Definitions
SLO
SLA
SLIKPI
Span
Trace
Prometheus
Node_Exporter
Grafana
Dashboard
Heads up Display
Digging Deeper
-
Read the rest of the chapter https://sre.google/workbook/monitoring/ and note anything else of interest when it comes to monitoring and dashboarding.
-
Look up the “ProLUG Prometheus Certified Associate Prep 2024” in Resources -> Presentations in our ProLUG Discord. Study that for a deep dive into Prometheus.
-
Complete the project section of “Monitoring Deep Dive Project Guide” from the prolug-projects section of the Discord. We have a Youtube video on that project as well. https://www.youtube.com/watch?v=54VgGHr99Qg
Reflection Questions
-
What questions do you still have about this week?
-
How can you apply this now in your current role in IT? If you’re not in IT, how can you look to put something like this into your resume or portfolio?
If you are unable to finish the lab in the ProLUG lab environment we ask you
rebootthe machine from the command line so that other students will have the intended environment.
Resources / Important Links
Required Materials
- Rocky 9.4+ - ProLUG Lab
- Or comparable Linux box
- root or sudo command access
Downloads
The lab has been provided for convenience below:
Setup monitoring with Grafana
-
Run through each of the three labs below in Killercoda:
-
While completing each lab think about the following:
- a. How does it tie into the diagram below?
- b. What could you improve, or what would you change based on your previous administration experience.

Conclusion
In the end monitoring is more an art than engineering. Sure, we can design all the systems to track all the things, but there’s no equation on what is the one right answer for any of this. You have to spend time with the systems, know what is important and what is an indicator of problems. Then, you have to consider your audience and how to best show them what they need to see.
Be sure to
rebootthe lab machine from the command line when you are done.
Overview
In this unit, we focus on baselining, benchmarking, testing methodology, and data analytics — all essential skills for Linux system administrators. These topics allow us to understand the current state of our systems, measure performance under varying loads, and validate improvements with real data.
We’ll explore how to gather accurate system information using tools like iostat, sar, stress, and iperf3, and learn how to develop test plans that can support decision-making and capacity planning. Whether you're justifying budget increases or validating a new storage solution, knowing how to gather and present performance data makes you a more effective administrator.
Learning Objectives
By the end of this unit, you will be able to:
- Define and use key concepts: baseline, benchmark, high watermark, scope, and methodology
- Use tools like sar, iostat, stress, and iperf3 to collect performance data
- Create and execute test plans to evaluate system behavior under different loads
- Apply data analytics concepts: descriptive, diagnostic, predictive, and prescriptive
- Communicate system performance clearly with stakeholders through objective evidence
Relevance & Context
Understanding how your systems behave under normal and stressful conditions is a cornerstone of professional Linux administration. In today’s environments, decisions about agents, updates, or infrastructure changes require proof — not guesswork.
This unit prepares you to be the voice of data in meetings with architects and management. From proving system utilization for budget requests to testing performance claims from vendors, these skills help you become a confident, evidence-driven engineer.
Prerequisites
Before starting Unit 12, you should have:
- Basic Linux administration skills and terminal comfort
- Familiarity with resource categories: CPU, memory, disk, and networking
- Access to a Rocky 9 (or similar) Linux system with sudo or root access
- Ability to install and use CLI tools (
dnf install,rpm, etc.)
Key Terms and Definitions
Baseline
Benchmark
High Watermark
Scope
Methodology
Testing
Control
Experiment
Analytics
- Descriptive
- Diagnostic
- Predictive
- Prescriptive
Instructions
Fill out the worksheet as you progress through the lab and discussions. Hold your worksheets until the end to turn them in as a final submission packet.
Resources / Important Links
Downloads
The worksheet has been provided below. The document(s) can be transposed to
the desired format so long as the content is preserved. For example, the .txt
could be transposed to a .md file.
Unit 12 Recording
Discussion Post #1
Scenario:
Your manager has come to you with another emergency.
He has a meeting next week to discuss capacity planning and usage of the system with IT upper management. He doesn’t want to lose his budget, but he has to prove that the system utilization warrants spending more.
-
What information can you show your manager from your systems?
-
What type of data would prove system utilization? (Remember the big 4: compute, memory, disk, networking)
-
What would your report look like to your manager?
Discussion Post #2
Scenario:
You are in a capacity planning meeting with a few of the architects. They have decided to add 2 more agents to your Linux systems, a Bacula Agent and an Avamar Agent. They expect these agents to run their work starting at 0400 every morning.
-
What do these agents do? (May have to look them up)
-
Do you think there is a good reason not to use these agents at this timeframe?
-
Is there anything else you might want to point out to these architects about these agents they are installing?
Discussion Post #3
Scenario:
Your team has recently tested a proof of concept of a new storage system. The vendor has published the blazing fast speeds that are capable of being run through this storage system. You have a set of systems connected to both the old storage system and the new storage system.
-
Write up a test procedure of how you may test these two systems.
-
How are you assuring these test are objective?
- What is meant by the term Ceteris Paribus, in this context?
Submit your input by following the link below.
The discussion posts are done in Discord Forums.
Definitions
Baseline:
Benchmark:
High watermark:
Scope:
Methodology:
Testing:
Control:
Experiment:
Analytics:
Digging Deeper (optional)
-
Analyzing data may open up a new field of interest to you. Go through some of the
free lessons on Kaggle, here: https://www.kaggle.com/learn- What did you learn?
- How will you apply these lessons to data and monitoring you have already
collected as a system administrator?
-
Find a blog or article that discusses the 4 types of data analytics.
- What did you learn about past operations?
- What did you learn about predictive operations?
-
Download Spyder IDE (Open source).
- Find a blog post or otherwise try to evaluate some data.
- Perform some Linear regression. My block of code (but this requires some
additional libraries to be added. I can help with that if you need it.)import matplotlib.pyplot as plt from sklearn.linear_model import LinearRegression size = [[5.0], [5.5], [5.9], [6.3], [6.9], [7.5]] price =[[165], [200], [223], [250], [278], [315]] plt.title('Pizza Price plotted against the size') plt.xlabel('Pizza Size in inches') plt.ylabel('Pizza Price in cents') plt.plot(size, price, 'k.') plt.axis([5.0, 9.0, 99, 355]) plt.grid(True) model = LinearRegression() model.fit(X = size, y = price) #plot the regression line plt.plot(size, model.predict(size), color='r')
Reflection Questions
-
What questions do you still have about this week?
-
How can you apply this now in your current role in IT?
If you’re not in IT, how can you look to put something like this into your resume or portfolio?
If you are unable to finish the lab in the ProLUG lab environment we ask you
rebootthe machine from the command line so that other students will have the intended environment.
Resources / Important Links
Required Materials
- Rocky 9.4+ - ProLUG Lab
- Or comparable Linux box
- root or sudo command access
Downloads
The lab has been provided for convenience below:
Pre-Lab Warm-Up
-
Create a working directory
mkdir lab_baseline cd lab_baseline -
Verify if
iostatis availablewhich iostatIf it’s not there:
# Find which package provides iostat dnf whatprovides iostat # This should tell you it's sysstat rpm -qa | grep -i sysstat # Install sysstat if needed dnf install sysstat # Verify installation rpm -qa | grep -i sysstat -
Verify if
stressis availablewhich stressIf it’s not there:
# Find which package provides stress dnf whatprovides stress # Install stress dnf install stress # Verify installation rpm -qa | grep -i stress rpm -qi stress # Read the package description -
Verify if
iperf3is availablewhich iperf3If it’s not there:
# Find which package provides iperf3
dnf whatprovides iperf

# Install iperf3
dnf install iperf

# Verify installation
rpm -qa | grep -i iperf
rpm -qi iperf
Lab 🧪
Baseline Information Gathering
The purpose of a baseline is not to find fault, load, or to take corrective action. A baseline simply determines what is. You must know what is so that you can test against that when you make a change to be able to objectively say there was or wasn't an improvement. You must know where you are at to be able to properly plan where you are going. A poor baseline assessment, because of inflated numbers or inaccurate testing, does a disservice to the rest of your project. You must accurately draw the first line and understand your system's performance.
Using SAR (CPU and memory statistics)
Some useful sar tracking commands. 10 minute increments.
# By itself, this gives the last day's processing numbers
sar

# Gives memory statistics
sar -r

# Gives swapping statistics (useful to check if system runs out of physical memory)
sar -W

# List SAR log files
ls /var/log/sa/

# View SAR data from a specific day of the month
sar -f /var/log/sa/sa28
For your later labs, you need to collect sar data in real time to compare with the
baseline data.
# View how SAR collects data every 10 minutes
systemctl cat sysstat-collect.timer

# Collect SAR data in real time (every 2 seconds, 10 samples)
sar 2 10

# Memory statistics (every 2 seconds, 10 samples)
sar -r 2 10
Using IOSTAT (CPU and device statistics)
iostat will give you either processing or device statistics for your system.
# Gives all information (CPU and device)
iostat

# CPU statistics only
iostat -c

# Device statistics only
iostat -d

# 1-second CPU stats until interrupted
iostat -c 1

# 1-second CPU stats, 5 times
iostat -c 1 5
Using iperf3 (network speed testing)
In the ProLUG lab, red1 is the iperf3 server, so we can bounce connections off it (192.168.200.101).
# TCP connection with 128 connections
time iperf3 -c 192.168.200.101 -n 1G -P 128

# UDP connection with 128 connections
time iperf3 -c 192.168.200.101 -u -n 1G -P 128
Using STRESS to generate load
stress will produce extra load on a system. It can run against proc, ram, and disk I/O.
# View stress usage information
stress

# Stress CPU with 1 process (will run indefinitely)
stress -c 1

# Stress multiple subsystems (this will do a lot of things)
stress --cpu 8 --io 4 --vm 2 --vm-bytes 128M -d 1 --timeout 10s
Read the usage output and try to figure out what each option does.
Developing a Test Plan
The company has decided we are going to add a new agent to all machines. Management has given this directive to you because of PCI compliance standards with no regard for what it may do to the system. You want to validate if there are any problems and be able to express your concerns as an engineer, if there are actual issues. No one cares what you think, they care what you can show, or prove.
Determine the right question to ask:
-
Do we have a system baseline to compare against?
- No? Make a baseline.
iostat -xh 1 10
- No? Make a baseline.
-
Can we say that this system is not under heavy load?
-
What does a system under no load look like performing tasks in our environment?
-
Assuming our systems are not running under load, capture SAR and baseline stats.
-
Perform some basic tasks and get their completion times.
- Writing/deleting 3000 empty files #modify as needed for your system
# Speed: ~10s time for i in `seq 1 3000`; do touch testfile$i; done # Removing them time for i in `seq 1 3000`; do rm -rf testfile$i; done # Writing large files for i in `seq 1 5`; do time dd if=/dev/zero of=/root/lab_baseline/sizetest$i bs=1024k count=1000; done # Removing the files for i in `seq 1 5`; do rm -rf sizetest$i ; done-
Testing processor speed
time $(i=0; while (( i < 999999 )); do (( i ++ )); done) # if this takes your system under 10 seconds, add a 9 -
Alternate processor speed test
time dd if=/dev/urandom bs=1024k count=20 | bzip2 -9 >> /dev/nullThis takes random numbers in blocks, zips them, and then throws them away.
Tune to about ~10 seconds as needed
-
- What is the difference between systems under load with and without the agent?
Run a load test (with stress) of what the agent is going to do against the system.
While the load test is running, do your same functions and see if they perform differently.
Execute the plan and gather data
Edit these as you see fit, add columns or rows to increase understanding of system performance. This is your chance to test and record these things.
System Baseline Tests
| Metric | Server 1 |
|---|---|
| SAR average load (past week) | |
| IOSTAT test (10 min) | |
| IOSTAT test (2s x 10 samples) | |
| Disk write - small files | |
| Disk write - small files (retry) | |
| Disk write - large files | |
| Processor benchmark |
You may baseline more than once, more data is rarely bad.
Make 3 different assumptions for how load may look on your system with the agent and design your stress commands around them (examples):
-
I assume no load on hdd, light load on processors
while true; do stress --cpu 2 --io 4 --vm 2 --vm-bytes 128M --timeout 30; done # -
I assume low load on hdd, light load on processors
while true; do stress --cpu 2-io 4 --vm 2 --vm-bytes 128M -d 1 --timeout 30; done -
I just assume everything is high load and it's a mess
while true; do stress --cpu 4 --io 4 --vm 2 --vm-bytes 256M -d 4 --timeout 30; done
In one window start your load tests (YOU MUST REMEMBER TO STOP THESE AFTER YOU GATHER
YOUR DATA).
In another window gather your data again, exactly as you did for your baseline with
sar and iostat just for the time of the test.
System Tests while under significant load
Put command you're using for load here:
| Metric | Server 1 |
|---|---|
| SAR average load (during test) | |
| IOSTAT test (10 min) | |
| IOSTAT test (2s x 10 samples) | |
| Disk write - small files | |
| Disk write - small files (retry) | |
| Disk write - large files | |
| Processor benchmark |
Continue copying and pasting tables as needed.
Reflection Questions (optional)
- How did the system perform under load compared to your baseline?
- What would you report to your management team regarding the new agent’s impact?
- How would you adjust your test plan to capture additional performance metrics?
Be sure to
rebootthe lab machine from the command line when you are done.
Overview
In this unit, we focus on system hardening — the process of configuring Linux systems to meet defined security standards. As threats evolve, system administrators play a key role in ensuring confidentiality, integrity, and availability by reducing attack surfaces and enforcing secure configurations.
We will explore industry benchmarks like STIGs and CIS, implement hardening techniques for services like SSH, identify unneeded software, and analyze system security posture using tools like the SCC Tool. You’ll also revisit baselining and documentation as part of security validation and compliance.
Learning Objectives
By the end of this unit, you will be able to:
- Define system hardening and understand its role in securing Linux servers
- Scan systems using the SCC Tool to assess security compliance
- Apply remediation steps based on STIG reports
- Harden services such as SSHD, remove unnecessary software, and lock down ports
- Rescan and verify improvements in your system’s security posture
- Understand the importance of documentation and change management in security
Relevance & Context
Security hardening helps ensure that systems are not only functional but also resilient against misuse and attacks. Whether aligning with PCI DSS, CIS benchmarks, or STIGs, hardening turns general-purpose Linux installs into mission-ready infrastructure.
This unit emphasizes security vs. accessibility, change management, and shared responsibility between security and operations. You’ll experience real-world practices like scanning, remediating, and verifying — essential skills for any administrator tasked with system security.
Prerequisites
Before starting Unit 13, you should have:
- A solid understanding of Linux system administration and services
- Comfort using the terminal and managing services with
systemctl - Ability to inspect ports, services, and installed software
- Familiarity with tools like
ss,rpm,dnf, andssh - Access to a Rocky Linux system with root/sudo privileges
- (Optional but recommended): Experience from Unit 12 on baselining and benchmarking
Key Terms and Definitions
Hardening
Pipeline
Change Management
Security Standard
Security Posture
Acceptable Risk
- NIST 800-53
STIG
CIS Benchmark
OpenSCAP
SCC Tool
HIDS
HIPS
Instructions
Fill out the worksheet as you progress through the lab and discussions. Hold your worksheets until the end to turn them in as a final submission packet.
Resources / Important Links
Downloads
The worksheet has been provided below. The document(s) can be transposed to
the desired format so long as the content is preserved. For example, the .txt
could be transposed to a .md file.
Unit 13 Recording
Discussion Post #1
Scenario:
Your security team comes to you with a discrepancy between the production security baseline and something that is running on one of your servers in production. There are 5 servers in a web cluster and only one of them is showing this behavior. They want you to account for why something is different.
-
How are you going to validate that the difference between the systems?
-
What are you going to look at to explain this?
-
What could be done to prevent this problem in the future?
Discussion Post #2
Scenario:
Your team has been giving you more and more engineering responsibilities.
You are being asked to build out the next set of servers to integrate into the development environment. Your team is going from RHEL 8 to Rocky 9.4.
-
How might you start to plan out your migration?
-
What are you going to check on the existing systems to baseline your build?
-
What kind of validation plan might you use for your new Rocky 9.4 systems?
Submit your input by following the link below.
The discussion posts are done in Discord Forums.
Definitions
Hardening:
Pipeline:
Change management (IT):
Security Standard:
Security Posture:
Acceptable Risk:
NIST 800-53:
STIG:
CIS Benchmark:
OpenSCAP:
SCC Tool:
HIDS:
HIPS:
Digging Deeper (Optional)
-
Run through this lab: https://killercoda.com/het-tanis/course/Linux-Labs/107-server-startup-process
- How does this help you better understand the discussion 13-2 question?
-
Run through this lab: https://killercoda.com/het-tanis/course/Linux-Labs/203-updating-golden-image
- How does this help you better understand the process of hardening systems?
Reflection Questions
-
What questions do you still have about this week?
-
How can you apply this now in your current role in IT? If you’re not in IT, how can you look to put something like this into your resume or portfolio?
If you are unable to finish the lab in the ProLUG lab environment we ask you
rebootthe machine from the command line so that other students will have the intended environment.
Resources / Important Links
- https://killercoda.com/het-tanis/course/Linux-Labs/207-OS_STIG_Scan_with_SCC_Tool
- https://public.cyber.mil/stigs/srg-stig-tools/
- https://nvd.nist.gov/vuln/search
Required Materials
- Rocky 9.4+ - ProLUG Lab
- Or comparable Linux box
- root or sudo command access
Downloads
The lab has been provided for convenience below:
Pre-Lab Warm-Up
EXERCISES (Warmup to quickly run through your system and familiarize yourself)
-
ss -ntulp- What ports are open on this server?
- What is open on port 9080?
- What does this service do?
-
systemctl --failed- Are there any failed units?
-
systemctl list-units --state=active- About how many active units are there?
systemctl list-units --state=active | wc -l
- About how many active units are there?
-
rpm -qa | wc -l- Approximately how many software packages do you have?
-
rpm -qa | grep -i ssh- How many ssh packages do you have?
- What is the version of openssh?
- Do you know if there are any known vulnerabilities for that version?
Lab 🧪
There will be three basic tasks for today’s labs:
- You will scan a server for a SCC Report and get a STIG Score
- You will remediate some of the items from the scan
- You will rescan and verify a better score.
SCC Report:
This lab portion can be done in the ProLUG Rocky servers, or in killercoda at this location: https://killercoda.com/het-tanis/course/Linux-Labs/207-OS_STIG_Scan_with_SCC_Tool
Testing hardening on the ProLUG Lab may take over an hour. You are welcome to perform the test there, but make sure you have some time.
ssh into a Rocky sever
cd /opt/scc
time ./cscc

# ---- Wait over an hour ------

cd /root/SCC/sessions #find the most recent run
Look in the results to see output.
Harden the system
-
Harden sshd
- Is your system hardened in this capacity?
- How did you check?
- Did the fix check work for you?
- How did you check?
-
Remove unneeded Software
- Read about cowsay –
man cowsay - Remove cowsay –
dnf remove cowsay
- Read about cowsay –
Rescan to validate change
ssh into a Rocky sever
cd /opt/scc
time ./cscc

# ---- Wait over an hour ------

cd /root/SCC/sessions #find the most recent run
Look in the results to see output.
Be sure to
rebootthe lab machine from the command line when you are done.
NOTE: This is an optional bonus section. You do not need to read it, but if you're interested in digging deeper, this is for you.
This bonus lab is designed to provide material and exercises in applying the skills and principles outlined by this course.
Students will:
- Install necessary lab dependencies,
fail2ban,ssh,nginx - Build troubleshooting, deductive reasoning, and investigative skills
- Edit configuration files, utilize many command line tools,
systemctl,vi - Understand specific use case cyber security tools
- And more
Resources / Important Links
- https://github.com/fail2ban/fail2ban
- https://www.digitalocean.com/community/tutorials/how-fail2ban-works-to-protect-services-on-a-linux-server
- https://nginx.org/en/docs/beginners_guide.html
- https://www.openssh.com/features.html
- https://docs.redhat.com/en/documentation/red_hat_enterprise_linux/8/html/configuring_and_managing_networking/getting-started-with-nftables_configuring-and-managing-networking#con_basics-of-nftables-tables_assembly_creating-and-managing-nftables-tables-chains-and-rules
- https://developers.cloudflare.com/waf/get-started/
Required Materials
- Rocky 9.4+ host
- Or comparable Linux box
- root or sudo command access
Bonus Pre-Lab Warm-Up
First lets identify a couple dependencies for this lab. Since many of the labs in
this course are predicated on Rocky we will provide commands like dnf and rpm
to accomplish this task:
rpm -ql openssh-server
This command will list configuration files and underlying dependent libraries required
to run an SSH server if openssh-server is installed locally. But be careful,
sometimes this query will list lingering configuration files and directories even though
it isn't installed.
To corroborate our findings, let's query dnf:
dnf list --installed | grep openssh-server
All else fails you can always attempt a find command to verify the presence of SSH
and its server side counter part SSHD (D for daemon):
find / -name ssh; find / -name sshd
You may need to use the -xdev flag if other filesystems are present or traversable that are
external to the host that find executes from, this flag comes in handy with WSL subsystems or
hosts residing within a hypervisor that have other host file systems mounted and accessible.
Fair warning, this command may spit out a lot of output. Familiarity with the Linux filesystem and its inner machinations should prepare you for this moment. If not, this command attempts to find every file with ssh or sshd in it from the root of the host's file system '/'.
If the piped grep or find command comes up empty openssh-server is likely not installed, attempt to
install it. Hopefully these commands and strategies are familiar to you:
dnf install openssh-server
Now repeat this process for nginx, and fail2ban.
What are nginx and fail2ban you ask?
Well now is a great time to use the man pages.
If a man command ever fails due to a lack of 'manual entry' that means you may need to
install the package or you have a path issue. However if the shell returns that the man
command is not found you may need to install man-db.
Hopefully it's becoming clear why understanding our tools, troubleshooting, and deductive reasoning skills come in handy!
dnf install -y nginx fail2ban man-db

# We should now be able to man nginx and fail2ban
# if we couldn't before

man nginx
man fail2ban
Now that they're installed let's enable sshd and nginx from systemctl.
systemctl enable --now sshd # the --now flag along will also start the service
systemctl enable --now nginx
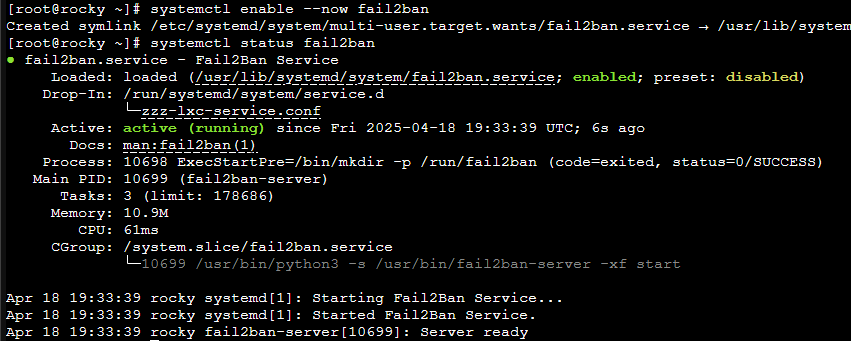
We should now be able to see these services are running in a myriad of ways:
ss -ntulp | grep ssh
ss -ntulp | grep nginx

systemctl status sshd
systemctl status nginx
Ideally these services are hosted on a student owned device/host and not the ProLUG lab
boxes. With these enabled it should be possible to ssh into the host or visit the nginx
web page via http://(localhost or {IP address}) from a web browser.
Technically you could curl localhost from the ProLUG Rocky box and capture the html
nginx hosts and ssh into the box from a different box to verify they are enabled.
Bonus Lab 🧪
SSH, NGINX and implementing Fail2Ban
When services like SSH and NGINX (pronounced 'engine-x') are exposed to the public internet it will become exceedingly apparent (in seconds if not minutes) within their log files that they are under bombardment from web scrapers, bots, hackers, and more.
The goals of these entities are either malicious, self serving, or helpful in the case of organizations like Palo Alto who build databases for cybersecurity purposes.
An example of an nginx access.log file with Palo Alto's Expanse web scraping arm is shown below:
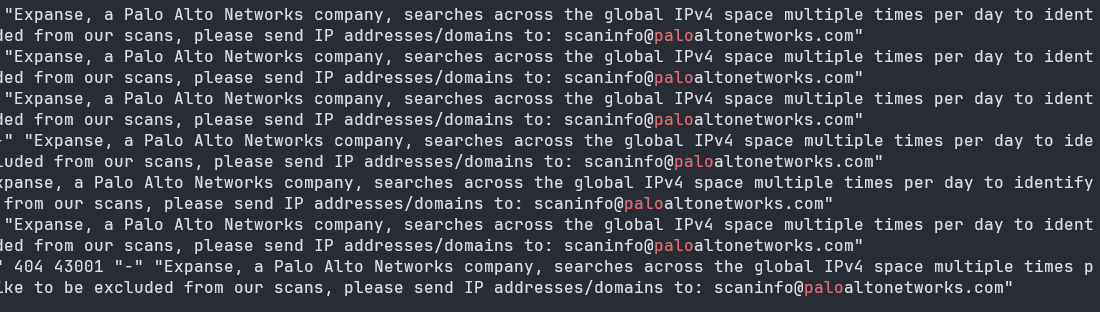
Fail2Ban
Fail2Ban is a small part of a larger solution in mitigating and monitoring these threats and actors. While more robust solutions exist from providers like Cloudflare or Fortinet this lab hopes to introduce a small foray into implementing a more manageable solution for students.
Plus, it's kinda cool and pretty fun.
How Fail2Ban Works
Fail2Ban is designed to analyze log files and manipulate the host's firewall to programmatically ban offending IP addresses based on various conditions predicated by specific configuration files.
First let's briefly skim Fail2Ban's main configuration file:
vi /etc/fail2ban.conf
# Fail2Ban main configuration file
#
# Comments: use '#' for comment lines and ';' (following a space) for inline comments
#
# Changes:  in most of the cases you should not modify this
#           file, but provide customizations in fail2ban.local file, e.g.:
#
# [DEFAULT]
# loglevel = DEBUG
#

[DEFAULT]

# Option: loglevel
# Notes.: Set the log level output.
#         CRITICAL
#         ERROR
#         WARNING
#         NOTICE
#         INFO
#         DEBUG
# Values: [ LEVEL ]  Default: INFO
#
loglevel = INFO

# Option: logtarget
# Notes.: Set the log target. This could be a file, SYSTEMD-JOURNAL, SYSLOG, STDERR or STDOUT.
#         Only one log target can be specified.
#         If you change logtarget from the default value and you are
#         using logrotate -- also adjust or disable rotation in the
#         corresponding configuration file
#         (e.g. /etc/logrotate.d/fail2ban on Debian systems)
# Values: [ STDOUT | STDERR | SYSLOG | SYSOUT | SYSTEMD-JOURNAL | FILE ]  Default: STDERR
#
logtarget = /var/log/fail2ban.log

Remaining output redacted...
Generally this file can remain in its default configuration. We are however interested in
its log path of /var/log/fail2ban.log. If we ever need to investigate or debug Fail2Ban
we now know where it logs its decisions when an actionable event arises.
A further configuration file we are interested in is Fail2Ban's jail.conf. Let's look at
Fail2Ban's man jail.conf entry first:
CONFIGURATION FILES FORMAT
 *.conf  files  are distributed by Fail2Ban.  It is recommended that *.conf files should
  remain unchanged to ease upgrades.  If needed, customizations should be provided in *.local files.
  For example, if you would like to enable the [ssh-iptables-ipset] jail specified in jail.conf,
  create jail.local containing

 jail.local
        [ssh-iptables-ipset]

        enabled = true

 In .local files specify only the settings you would like to change and the rest of the configuration
  will then come from the corresponding .conf file which is parsed first.

 jail.d/ and fail2ban.d/

        In addition to .local, for jail.conf or fail2ban.conf file there can be a corresponding .d/
        directory containing additional .conf  files.  The order e.g. for jail configuration would be:

        jail.conf
        jail.d/*.conf (in alphabetical order)
        jail.local
        jail.d/*.local (in alphabetical order).

        i.e.  all  .local  files  are  parsed after .conf files in the original configuration file and files
        under .d directory.  Settings in the file parsed later take precedence over identical entries in
        previously parsed files.  Files are ordered alphabetically, e.g.

        fail2ban.d/01_custom_log.conf - to use a different log path
        jail.d/01_enable.conf - to enable a specific jail
        jail.d/02_custom_port.conf - to change the port(s) of a jail.
This section is what we are most interested in. We see that Fail2Ban recommends utilizing jail.local
files and drop-in directories to preserve initial configuration files and to facilitate updates down
the road.
Further, lets now take a brief look at the jail.conf file and get an understanding of the options
available to us. While this is a lot of information to take in it should be embraced for this is the
bread and butter of becoming a better administrator. Understanding the tools available to us.
And for what it's worth, we don't need to know this tool down to its quantum level. "Just enough to get the job done."
vi /etc/fail2ban/jail.conf
Understanding jail configuration options as shown below are some of the many configuration details that will go a long way to intelligently protecting our services and systems.
#
# MISCELLANEOUS OPTIONS
#

# "bantime.increment" allows to use database for searching of previously banned ip's to increase a
# default ban time using special formula, default it is banTime * 1, 2, 4, 8, 16, 32...
#bantime.increment = true

# "bantime.maxtime" is the max number of seconds using the ban time can reach (doesn't grow further)
#bantime.maxtime =

# "bantime.factor" is a coefficient to calculate exponent growing of the formula or common multiplier,
# default value of factor is 1 and with default value of formula, the ban time
# grows by 1, 2, 4, 8, 16 ...
#bantime.factor = 1
Implementing Fail2Ban
Let's keep these types of options in mind and now look at an example of a basic jail.local file to
protect our SSH server.
Based upon our observations earlier this command will make the necessary jail.local file we will
need in its proper directory.
vi /etc/fail2ban/jail.local
And now let's define some necessary options to begin protecting SSH from broad attack.
[DEFAULT]
bantime            =  1h
maxretry           =  2
bantime.increment  =  true
bantime.factor     =  12
bantime.maxtime    =  5w
ignoreip           =  {IP_ADDRESS} # useful to prevent banning oneself

[sshd]
backend            =  systemd # required for systemd based systems
enabled            =  true
Let's make sure to save our new jail.local file before we restart Fail2Ban. The following command
will write and persist the local jail configuration file and quit out of Vim, if you didn't know how
to do this already.
:wq
It took a lot to get here but it's important to understand our firearms before we fire them. For something like Fail2Ban could potentially permanently lock us out of a system under the right circumstances and make us have a very bad day indeed.
While there are more options available for a jail.local file, this should suffice to ban repeat
offenders who attempt to use an incorrect password on the SSH service. Any other required definitions
to properly implement this jail.local file for SSH will be parsed before hand as was stipulated in
the man page and the jail.conf file.
After that we must restart the Fail2Ban service to implement our changes.
systemctl restart fail2ban
Monitoring Fail2Ban
Now if everything is configured properly we should be able to input the following command to see a list of currently banned IP addresses:
fail2ban-client status sshd
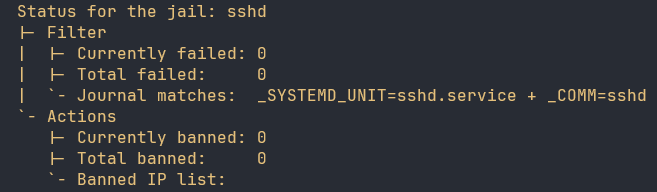
Typically SSH services should not be exposed publicly to the internet, and if they are they should utilize public key infrastructure (PKI) with specific security constraints (see STIG or CIS Benchmark Controls). Generally It is a far better solution to lock SSH access behind an internal or Virtual Private Network (VPN) where the potential of a "slow brute-force" attack will be mitigated almost entirely.
However you still might institute Fail2Ban even behind a VPN in the event a threat actor does gain access to the VPN and attempts to brute force or slow brute force attack hosts with SSH services exposed that utilize passwords instead of PKI. However in this day and age password protected SSH access could be considered a security controls finding. Use PKI whenever possible.
NGINX
If you've made it this far I appreciate your tenacity or perhaps deep captivation of this subject.
Now where Fail2Ban really shines is when integrated with an application like nginx.
As we'll see Fail2Ban allows us to configure what they call "filters" that can further protect nginx and our website,
if we had one. Since this lab has ran long I will keep it brief.
Suffice it say for students this is theory, but as I will mention later these filters can be quite powerful.
Let's look at what is available to us for nginx:
ls /etc/fail2ban/filter.d/ | grep nginx
nginx-bad-request.conf
nginx-botsearch.conf
nginx-error-common.conf
nginx-forbidden.conf
nginx-http-auth.conf
nginx-limit-req.conf
Well, what do we have here?
I encourage you to explore all of these available filters however in my experience the
nginx-bad-request.conf filter has been most useful in banning bad actors.
cat /etc/fail2ban2/filter.d/nginx-bad-request.conf
# Fail2Ban filter to match bad requests to nginx
#

[Definition]

# The request often doesn't contain a method, only some encoded garbage
# This will also match requests that are entirely empty
failregex = ^<HOST> - \S+ \[\] "[^"]*" 400

datepattern = {^LN-BEG}%%ExY(?P<_sep>[-/.])%%m(?P=_sep)%%d[T ]%%H:%%M:%%S(?:[.,]%%f)?(?:\s*%%z)?
              ^[^\[]*\[({DATE})
              {^LN-BEG}

journalmatch = _SYSTEMD_UNIT=nginx.service + _COMM=nginx

# Author: Jan Przybylak
Whenever nginx receives a "bad request", think
an HTTP method request for a link, file, or API call that is malformed or improperly formatted from a client, Fail2Ban
will recognize it from the nginx access.log by an HTTP Status Code 400 returned by nginx and act appropriately based
upon our default action options.
(After 2 bad requests, you get banned for an hour. After that timeout, if you send 2 more bad requests the timeout is extended for 12 hours, growing exponentially for each occurrence afterwards up to a 5 week ban. It is typically advised against implementing permanent bans as over time this could lead to potentially significant overhead for the host or lockout legitimate users unintentionally.)
When running this filter on my own personal nginx web server over the course of 30 days I will have banned over 40,000 IP addresses with varying ban times. But note that this filter can and will match requests that are malformed from the site itself. If a link or API implementation hosted from the nginx web server is incorrect Fail2Ban could be banning legitimate traffic unintentionally. Be sure to observe due diligence in log files or web traffic when first implementing such a filter.
As of rebooting my publicly available website not minutes ago this is how many IP addresses are already banned.
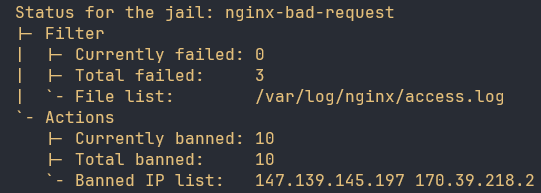
Ideally Fail2Ban is configured to utilize nftables, a modernized and significantly improved Linux firewall backend solution,
and some type of firewall backend wrapper like firewalld which can be configured for specific firewall backend
architectures like iptables, and nftables.
Configuring Fail2Ban with firewalld or nftables will look like such:
[DEFAULT]
..etc
banaction           =  firewallcmd-rich-rules[actiontype=<multiport>]
banaction_allports  =  firewallcmd-rich-rules[actiontype=<allports>]

# Or

[DEFAULT]
..etc
banaction           =  nftables
banaction_allports  =  nftables[type=allports]
And here is how Fail2Ban modifies an iptables chain.
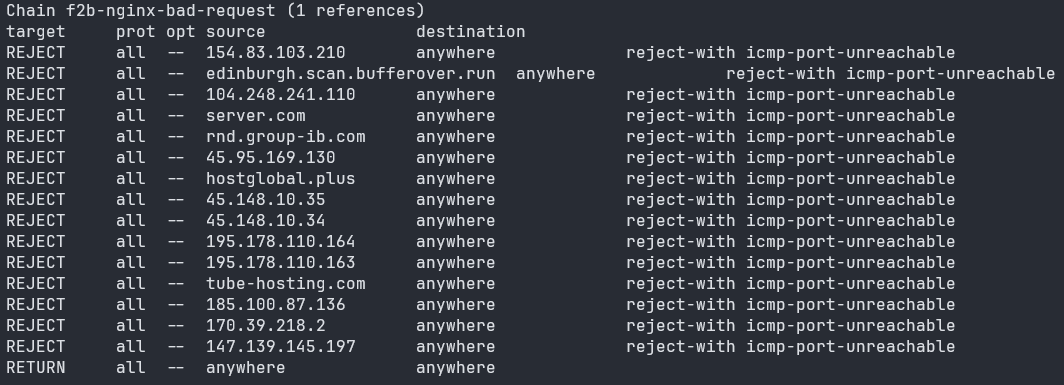
I highly, highly encourage students have a working understanding of Linux firewalls and their components like tables and chains.
It's important to be stated that this should be understood as a mitigation, not a perfect solution. Primarily to minimize automated bots scraping a domain, usually for nefarious purposes.
And I will iterate that there are far better solutions. Some for free and others, (Cloudflare WAF), for a modest fee that protect more intelligently and robustly than Fail2Ban. Migrating your domain over to Cloudflare or equivalent service is probably the far smarter and less work intensive task than a comprehensive Fail2Ban setup. But I like to think we're building our muscles... you know, putting in reps.
Filter Implementation
Remembering our previous configurations we know that if a user sends more than two malformed, either malicious or unintentional, requests to our website they will be temporarily banned.
vi /etc/fail2ban/jail.local
Here is what the configuration file should look like after we implement this filter:
[nginx-bad-request]
enabled  =  true
port     =  http,https
logpath  =  %(nginx_access_log)s
Append these lines to the earlier file we implemented after our SSHD section and let the regex do the work for us.
Be sure to save the file:
:wq
Then finally restart Fail2Ban again:
systemctl restart fail2ban
It's as simple as that.
You can use fail2ban-client status nginx-bad-request to monitor any actions Fail2Ban has taken to ban bad actors
or investigate the /var/log/fail2ban.log file.
Well that about wraps it up. There is far more to consider when it comes to protecting web servers and SSH, but hopefully this was a good primer and helped exercise those Linux muscles.
Overview
This unit introduces Ansible Automation, a powerful open-source tool used for IT automation, configuration management, and application deployment. By the end of this unit, you will understand how to implement Ansible in enterprise environments to manage Linux infrastructure efficiently.
- Configuration Management: Automate system configurations across multiple hosts.
- Infrastructure as Code (IaC): Define infrastructure using Ansible playbooks.
- Automation: Execute tasks across multiple systems in an efficient, repeatable manner.
Learning Objectives
By the end of this unit, you should be able to:
- Set up and configure Ansible on a Linux system.
- Understand Ansible inventory and playbooks.
- Automate common administrative tasks.
- Use ad-hoc commands and Ansible modules effectively.
Relevance & Context
- Consistency: Automate repetitive tasks to ensure uniform configurations.
- Scalability: Manage thousands of servers with minimal manual intervention.
- Security & Compliance: Enforce policies and reduce misconfigurations.
Prerequisites
Before beginning this unit, ensure you understand:
- Basic Linux command-line operations.
- SSH and remote system management.
- YAML syntax and basic scripting.
Key Terms and Definitions
Playbook
Task
Inventory
Ad-hoc Commands
Roles
Instructions
Fill out the worksheet as you progress through the lab and discussions. Hold your worksheets until the end to turn them in as a final submission packet.
Resources / Important Links
Downloads
The worksheet has been provided below. The document(s) can be transposed to
the desired format so long as the content is preserved. For example, the .txt
could be transposed to a .md file.
Unit 14 Recording
Discussion Post 1
Refer to your Unit 5 scan of the systems.
You know that Ansible is a tool that you want to maintain in the environment. Review this online documentation: https://docs.ansible.com/ansible/latest/inventory_guide/intro_inventory.html
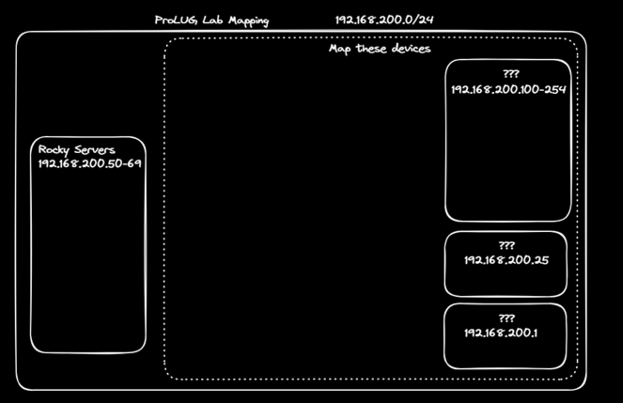
- Make an inventory of the servers, grouped any way you like.
- What format did you choose to use for your inventory?
- What other things might you include later in your inventory to make it more useful?
Discussion Post 2
You have been noticing drift on your server configurations, so you want a way to generate a report on them every day to validate the configurations are the same.
Use any lab in here to find ideas: https://killercoda.com/het-tanis/course/Ansible-Labs
Discussion Post 3
Using ansible module for git, pull down this repo: https://github.com/het-tanis/HPC_Deploy.git
- How is the repo setup?
- What is in the roles directory?
- How are these playbooks called, and how do roles differ from tasks?
Submit your input by following the link below.
The discussion posts are done in Discord Forums.
Definitions
Automation:
Consistency:
Dev/Ops:
Timelines:
Git:
Repository:
Ad-hoc:
Playbook:
Task:
Role:
SSH (Secure Shell):
WinRM (Windows Remote Management):
Digging Deeper (Optional)
-
I have a large amount of labs to get you started on your Ansible Journey (all free): https://killercoda.com/het-tanis/course/Ansible-Labs
-
Find projects from our channel Ansible-Code, in Discord and find something that is interesting to you.
-
Use Ansible to access secrets from Hashicorp Vault: https://killercoda.com/het-tanis/course/Hashicorp-Labs/004-vault-read-secrets-ansible
Reflection Questions
-
What questions do you still have about this week?
-
How can you apply this now in your current role in IT?
-
If you’re not in IT, how can you look to put something like this into your resume or portfolio?
If you are unable to finish the lab in the ProLUG lab environment we ask you
rebootthe machine from the command line so that other students will have the intended environment.
Resources / Important Links
Required Materials
- Rocky 9.4+ - ProLUG Lab
- Or comparable Linux box
- root or sudo command access
Downloads
The lab has been provided for convenience below:
Warmup Exercises
Quickly run through your system and familiarize yourself:
mkdir /root/ansible_madness
cd /root/ansible_madness
dnf whatprovides ansible   # Where is Ansible installed from?
ansible --version          # What version of Ansible is installed?
ansible-<TAB>              # What other ansible-* tools are available?
ansible localhost -m shell -a uptime  # Compare with standalone `uptime`
ansible -vvv localhost -m shell -a uptime  # What extra info does -vvv show?
Lab Exercises
Create an Inventory File
While in /root/ansible_madness, create a file called hosts:
vi /root/ansible_madness/hosts
Add the following contents:
[servers]
192.168.200.101
192.168.200.102
192.168.200.103
Run Ad Hoc Commands
Test connectivity into the servers:
ansible servers -i hosts -u inmate -k -m shell -a uptime
- Use password:
LinuxR0cks1!
Verbose version:
ansible -vvv servers -i hosts -u inmate -k -m shell -a uptime
Create a Playbook to Push Files
- Create a test file:
echo "This is my file <yourname>" > somefile
- Create
deploy.yaml:
---
- name: Start of push playbook
  hosts: servers
  vars:
  gather_facts: True
  become: False
  tasks:
    - name: Copy somefile over at {{ ansible_date_time.iso8601_basic_short }}
      copy:
        src: /root/ansible_madness/somefile
        dest: /tmp/somefile.txt
- Run the playbook:
ansible-playbook -i hosts -k deploy.yaml
- Verify the file was pushed everywhere:
ansible servers -i hosts -u inmate -k -m shell -a "ls -l /tmp/somefile"
Pull Down a GitHub Repo
git clone https://github.com/het-tanis/HPC_Deploy.git
cd HPC_Deploy
Then reflect:
- What do you see in here?
- What do you need to learn more about to deploy some of these tools?
- Can you execute some of these? Why or why not?
Be sure to
rebootthe lab machine from the command line when you are done.
Overview
In this unit, we focus on incident management, root cause analysis, and troubleshooting frameworks. These are foundational skills for Linux administrators who are responsible for maintaining system reliability and responding effectively to issues.
You’ll explore structured approaches like the Scientific Method, 5 Whys, FMEA, and PDCA, as well as methodologies like Six Sigma, TQM, and systems thinking. We’ll also look at tools for visual problem solving, including the Fishbone Diagram and Fault Tree Analysis, and discuss how data types play a role in investigations.
Learning Objectives
By the end of this unit, you will be able to:
- Apply the Scientific Method to real-world troubleshooting scenarios
- Understand and use structured methods like FMEA, 5 Whys, and PDCA
- Differentiate between continuous and discrete data in diagnostics
- Use visual tools like Fishbone Diagrams and Fault Tree Analysis to trace causes
- Explain the OSI model as it applies to layered troubleshooting
- Leverage concepts from Six Sigma and 5S methodology to organize your workflows
- Document and communicate incidents effectively with post-mortem writeups
Relevance & Context
Troubleshooting is not guesswork — it’s a discipline. Whether you’re debugging a failed deployment or analyzing a high watermark in system performance, incident management requires both technical skill and structured reasoning.
This unit bridges engineering troubleshooting and administrative troubleshooting, providing multiple models to approach problems methodically. These frameworks are used by professionals across industries to maintain uptime, solve complex problems, and continuously improve system reliability.
Prerequisites
Before starting Unit 15, you should have:
- A working knowledge of Linux system administration
- Familiarity with logs, alerts, and system metrics
- Understanding of basic monitoring and baseline performance concepts
- Comfort using Linux command-line tools and interpreting output
Key Terms and Definitions
Incident
Problem
FMEA
Six Sigma
TQM
Post Mortem
Scientific Method
Iterative
Discrete data
- Ordinal
- Nominal (binary - attribute)
Continuous data
Risk Priority Number (RPN)
5 Whys
Fishbone Diagram (Ishikawa)
Fault Tree Analysis (FTA)
PDCA
SIPOC
Instructions
Fill out the worksheet as you progress through the lab and discussions. Hold your worksheets until the end to turn them in as a final submission packet.
Resources / Important Links
Downloads
The worksheet has been provided below. The document(s) can be transposed to
the desired format so long as the content is preserved. For example, the .txt
could be transposed to a .md file.
Unit 15 Recording
Unit 15 Discussion Post #1
Scenario:
Your management is all fired up about implementing some Six Sigma processes around the company. You decide to familiarize yourself and get some basic understanding to pass along to your team. Six Sigma Intro
- Page 56 – What about the “5S” methodology might help us as a team of system administrators? (Think of your virtual or software workspaces)
- Page 94 - What are the four layers of process definition? How would you explain them to your junior engineers?
Unit 15 Discussion Post #2
Your team looks at a lot of visual data. You decide to write up an explanation for them to explain what they look at.
- What is a high water mark? Why might it be good to know in utilization of systems?
- What is an upper and lower control limit in a system output? While this isn’t exactly what we’re looking at, why might it be good to explain to your junior engineers
Submit your input by following the link below.
The discussion posts are done in Discord Forums.
Definitions
Incident:
Problem:
FMEA:
Six Sigma:
TQM:
Post Mortem:
Scientific Method:
Iterative:
Discrete data:
Ordinal:
Nominal (binary – attribute):
Continuous data:
Risk Priority Number (RPN):
5 Whys:
Fishbone Diagram (Ishikawa):
Fault Tree Analysis (FTA):
PDCA:
SIPOC:
Digging Deeper
- Spend more time in Six Sigma Intro a. Page 243 – Starts looking at visual data analysis.
- Get your White belt (Free) Six Sigma Certification.
Reflection Questions
- What questions do you still have about this week?
- How can you apply this now in your current role in IT? If you’re not in IT, how can you look to put something like this into your resume or portfolio?
No lab for unit 15. Work on your projects.
Overview
This unit introduces Incident Response, a critical discipline in cybersecurity and systems administration focused on identifying, containing, eradicating, recovering from, and learning from system incidents. This unit also demonstrates the crucial need for policies and procedures in the likely event an incident occurs which facilitate successful remedies for administrators during stressful events.
By the end of this unit, you'll understand the key phases and practices for developing and executing an effective incident response plan within enterprise environments to minimize the impact of system incidences.
Learning Objectives
By the end of this unit, you should be able to:
- Define the stages of the incident response lifecycle.
- Understand the roles and responsibilities within an incident response team.
- Outline steps for initial incident detection and triage.
- Describe methods for system recovery and post-incident analysis.
Relevance & Context
Incident response is paramount as it directly impacts an organization's ability to minimize the damage and financial costs associated with events like misconfigurations, bugs, security breaches or vulnerabilities, and more by enabling rapid action.
An effective incident response plan also ensures business continuity, allowing systems and data to be restored efficiently and maintaining critical operations. Furthermore, robust incident response demonstrates adherence to regulatory compliance and builds trust with customers and stakeholders.
Prerequisites
Before beginning this unit, ensure you understand:
- Basic networking concepts (TCP/IP, common protocols).
- Fundamental operating system concepts (Linux/Windows file systems, processes, logging).
- How to troubleshoot
systemctland systemd,fstab,mount, and Logical Volume Manager (LVM) tools. - Linux disk, partition, and mount configurations.
dnfand how to update system packages.
Instructions
No worksheet or discussion for this unit, course wrap up and lecture only.
Unit 16 Recording
The unit 16 lab will be done during the lecture. Students will troubleshoot problems on systems in the ProLUG lab environment.
If you are unable to finish the lab in the ProLUG lab environment we ask you
rebootthe machine from the command line so that other students will have the intended environment.
Required Materials
- Rocky 9.4+ - ProLUG Lab
- Or comparable Linux box
- root or sudo command access
Downloads
The lab has been provided for convenience below:
LAB
You have the answers here, if they ask, you may give them hints. Otherwise, you can help them find the right solution any way you want to.
Scenario 1:
- Connect to
tshoot1@prolug.asuscomm.com - Password:
A ticket has come in that the web server is not running on the web server.
To complete this event the following three must be correct.
-
Web server must be running.
- HINT:
systemctl status httpd
- HINT:
-
Web server must respond on port 80.
- HINT: Can you check the open ports?
-
Ensure that the server can be reached by external connection attempts on port 80.
- HINT: Is the firewall running?
systemctl status firewalld
- HINT: Is the firewall running?
Scenario 2:
- Connect to
tshoot2@prolug.asuscomm.com - Password:
A ticket has come in that a mount point, /space, is not working correctly. The team expected a
9GB partition to be built there on the 3 attached disks, but found that it was not a separate
partition.
Verify that /space is not set up correctly.
- HINT: You may want to revisit lab 3 of the course for this one. This is a challenge here.
To complete this event the following four must be correct.
-
The three disks must be properly set up in LVM.
- HINT: use
mkfsto make a filesystem.
- HINT: use
-
EXT4 or XFS must be installed on the logical volume.
- HINT: Use your
pvs,vgs,lvstools
- HINT: Use your
-
/spacemust be created and mounted off on this filesystem.- Hint: Make the directory
/etc/fstaborsystemdmust have an entry for/space(do not reboot during the lab, as this will not work).
Same way as above.
Scenario 3:
- Connect to
tshoot3@prolug.asuscomm.com - Password:
Your team is trying to update your servers during a maintenance window. Your junior administrator kicks you over a server that they cannot get to update.
To complete this event the following two must be correct.
-
Fix the system to be able to update via
dnf.- HINT: DNF isn’t updating, so where are the repos that it looks for?
-
Verify that kernel updates are happening.
- HINT: Where can updates be excluded in DNF or Yum?
Be sure to
rebootthe lab machine from the command line when you are done.
Outro
Wow — you made it to the end of the course! That’s a lot of information to cover, so take a moment to congratulate yourself. We hope you took good notes, because you’ll be coming back to them in the future. Keep a link to this book as well — it’s always here as a handy reference.
By now, you should have a deeper understanding of core Linux functionality and how to manage it. You also have a clearer picture of the administrator’s role in relation to broader operational duties.
We hope you had fun and maybe even made some friends along the way. More importantly, we hope this course has inspired you to continue your studies and get involved in other ProLUG courses.
If you are participating in the group course, remember that you still have a final assignment to complete.
Finally, we’d greatly appreciate it if you helped spread the word by sharing your experience with others and letting them know how they can get involved. A good starting point is ProLUG.org.
This is a comprehensive list of all external resources used in this course.Unit 1 - Linux File Operations
- https://www.youtube.com/watch?v=d8XtNXutVto
- https://vim-adventures.com/
- Linux CLI Cheatsheets
- The Linux Foundation
- What is Vim?
Unit 2 - Essential Tools
Unit 3 - Storage
- Ubuntu Documentation on LVM
- Implementing SLOs
- AWS Real-Time Communication Whitepaper
- Building Secure and Reliable Systems
- here
- Red Hat High Availability Cluster Configuration
- AWS High Availability Architecture Guide
- Google SRE Book - Implementing SLOs
Unit 4 - Operating Running Systems
- tldp.org's cron guide
- here
- Cron Wiki page
- Killercoda Labs
- https://en.wikipedia.org/wiki/Battle_drill
- https://zeltser.com/media/docs/security-incident-survey-cheat-sheet.pdf?msc=Cheat+Sheet+Blog
- https://cio-wiki.org/wiki/Operations_Bridge
- Battle Drills
- Security Incident Cheatsheet
- Operations Bridge
Unit 5 - Managing Users and Groups
- https://www.cobalt.io/blog/defending-against-23-common-attack-vectors
- https://owasp.org/www-project-top-ten/
- https://attack.mitre.org/
- Attack Vectors
- attack.mitre.org
- OWASP Top Ten
- Killercoda lab by FishermanGuyBro
- Rocky Linux User Admin Guide
- RedHat: User and Group Management
Unit 6 - Firewalls
- Firewalld Official Documentation
- https://docs.rockylinux.org/zh/guides/security/firewalld-beginners/
- Wikipedia entry for Next-Gen Firewalls
- Official UFW Documentation
- RedHat Firewalld Documentation
- Official Firewalld Documentation
- Zellij Site
- GNU Screen Manual
- GNU Screen Site
- Tmux Cheatsheet
- Tmux Wiki
Unit 7 - Package Management & Patching
- https://en.wikipedia.org/wiki/Yellow_Dog_Linux
- dpkg backend
- the apt frontend
- Rocky Repository Guidance
- https://semver.org/
- Rocky DNF Guidance
- Rocky Documentation
- Semantic Versioning
- Using sha256sum
- Verifying RPM Packages
- AIDE Documentation
- RPM Man Page
Unit 8 - Scripting
- https://en.wikipedia.org/wiki/Truth_table
- https://tldp.org/LDP/Bash-Beginners-Guide/html/sect_07_03.html
- https://tldp.org/LDP/Bash-Beginners-Guide/html/sect_07_02.html
- https://tldp.org/LDP/Bash-Beginners-Guide/html/sect_07_01.html
- devhints.io - Bash Scripting Cheatsheet
- TLDP Bash Beginner's Guide
- Truth Table - Wikipedia
- Operate Running Systems lab
- Unit #8 Bonus (Bash Scripting) Page
- Unit #1 Bonus (VIM) Page
- Wikipedia Page for Truth Table
- [Wikipedia Page for the C Programming Lang](<https://en.wikipedia.org/wiki/C_(programming_language)
- Wikipedia Page for Compilers
Unit 9 - Containerization on Linux
- https://docs.podman.io/en/latest/markdown/podman-exec.1.html
- https://docs.docker.com/build/concepts/dockerfile/
- https://podman.io/docs
- https://killercoda.com/k3s/scenario/intro
- Podman Command List
- Dockerfile Reference Page
Unit 10 - Kubernetes
- Kubernetes Troubleshooting Guide
- K3s Official Site
- Kubernetes Documentation
- KillerShell Kubernetes Security
- Docker Security Best Practices
- Interactive Kubernetes Labs
- K3s Official Documentation
- Kubernetes Overview
- Kubernetes Security Best Practices
- Kubernetes Hardening Guide
- Pod Security Standards
- NetworkPolicy Editor
Unit 11 - Monitoring
- https://www.youtube.com/watch?v=54VgGHr99Qg
- https://promlabs.com/promql-cheat-sheet/
- https://sre.google/workbook/monitoring/
- Monitoring Linux Using SNMP - Nagios
- 30 Linux System Monitoring Tools Every SysAdmin Should Know
- How to easily monitor your Linux server | Grafana Labs
- Lab Monitoring Diagram
- https://killercoda.com/het-tanis/course/Linux-Labs/104-monitoring-linux-Influx-Grafana
- https://killercoda.com/het-tanis/course/Linux-Labs/103-monitoring-linux-telemetry
- https://killercoda.com/het-tanis/course/Linux-Labs/102-monitoring-linux-logs
Unit 12 - Baselines & Benchmarks
- Kaggle - Python and Data Science Learning
- iperf3 Documentation
- stress GitHub
- iostat Manual
- SAR Documentation
Unit 13 - System Hardening
- https://nvd.nist.gov/vuln/search
- https://public.cyber.mil/stigs/srg-stig-tools/
- https://killercoda.com/het-tanis/course/Linux-Labs/207-OS_STIG_Scan_with_SCC_Tool
- https://killercoda.com/het-tanis/course/Linux-Labs/203-updating-golden-image
- https://killercoda.com/het-tanis/course/Linux-Labs/107-server-startup-process
- Killercoda Lab - Updating a Golden Image
- Killercoda Lab - Server Startup Process
- Cloudflare WAF
- architectures
- a modernized and significantly improved Linux firewall backend solution
- "bad request"
- nginx
- public key infrastructure
- https://developers.cloudflare.com/waf/get-started/
- https://docs.redhat.com/en/documentation/red_hat_enterprise_linux/8/html/configuring_and_managing_networking/getting-started-with-nftables_configuring-and-managing-networking#con_basics-of-nftables-tables_assembly_creating-and-managing-nftables-tables-chains-and-rules
- https://www.openssh.com/features.html
- https://nginx.org/en/docs/beginners_guide.html
- https://www.digitalocean.com/community/tutorials/how-fail2ban-works-to-protect-services-on-a-linux-server
- https://github.com/fail2ban/fail2ban
Unit 14 - Ansible Automation
- HPC_Deploy Repo
- Killercoda - Ansible Labs
- Ansible Documentation
- https://killercoda.com/het-tanis/course/Hashicorp-Labs/004-vault-read-secrets-ansible
- https://github.com/het-tanis/HPC_Deploy.git
- https://killercoda.com/het-tanis/course/Ansible-Labs
- https://docs.ansible.com/ansible/latest/inventory_guide/intro_inventory.html
- YAML Syntax Guide
- Ansible GitHub Repository
- Official Ansible Documentation
Unit 15 - Troubleshooting
Unit 16 - Incident Response
Misc
- ProLUG.org
- Killercoda
- https://github.com/ProfessionalLinuxUsersGroup/lac/
- https://www.youtube.com/watch?v=eHB8WKWz2eQ&list=PLyuZ_vuAWmprPIqsG11yoUG49Z5dE5TDu
- worksheet
- lab
- bonus
- intro
- template pages wiki
- https://git-scm.com/book/en/v2/Git-Tools-Stashing-and-Cleaning
- https://www.atlassian.com/git/tutorials/saving-changes/git-stash
- great write-up on this procedure
- https://git-scm.com/book/en/v2/Git-Branching-Rebasing
- original repository link
- GitHub CLI
- freeCodeCamp's Git and GitHub Crash Course (1hr)
- Fireship's How to use Git and Github (12m)
- ByteByteGo's Git Explained in 4 Minutes (4m)
- https://git-scm.com/doc
- Git
- Git Pages workflow
- mdBook
- overleaf.com
- Draw.io
- Excalidraw.com
- GitHub
- Scott Champine
This book was made possible by a small group of dedicated contributors who worked diligently to create an accessible resource for future students enrolled in courses offered by the Professional Linux User Group.
The group met weekly to organize efforts, manage contributions, and onboard new volunteers. Using Git for version control and GitHub for project management, they converted existing courseware into Markdown and HTML. The content was then compiled with mdBook into a fast, searchable, multimedia learning resource.
Lead Authors
- Scott Champine
GitHub – Prolug founder, Lead Author, network & security engineer, CISSP, Linux instructor.
Organizing Contributors:
- Chris McKee
- Connor Wilkins
- Trevor Smale
- Shane Dugas
Writing Contributors:
- Chris McKee
- Connor Wilkins
- Trevor Smale
- Shane Dugas
- Maro Boneza
- Enzo Barcellos
- Thong Huynh
- Marlon Mejia
- Chigozie Umeh
- Joey Rockhold
- Trafficking*
- Mohamadou Sall
- AntonJJ*
The Professional Linux Users Group (ProLUG) provides a set of requirements and guidelines to contribute to this project. Below are steps to ensure contributors are adhering to those guidelines and fostering a productive version control environment.
Table of Contents
- How to be a Successful Contributor
- Signing your Git Commits with SSH
- Syncing your Fork with the Upstream ProLUG Repo
- Basic Contribution Workflow
- Supporting Material
How to be a Successful Contributor
To be an effective contributor understanding Git, whether through the command line or an external tool, will be an important part of contributing. To this effect it is important that any individual who contributes to this project have a working understanding of committing, merging, and other fundamental Git workflows.
For clarity this project utilizes GitHub for remote repositories and CI/CD testing pipeline workflows. Git and GitHub are two separate entities where GitHub provides the hosting services and Git provides the version control.
Prospective contributors are directed to several resources should they feel their competency with Git or GitHub falls short:
Git documentation:
Git and GitHub video tutorials:
- ByteByteGo's Git Explained in 4 Minutes (4m)
- Fireship's How to use Git and Github (12m)
- freeCodeCamp's Git and GitHub Crash Course (1hr)
Signing your Git Commits with SSH
Contributors who elect to contribute through the command line will need to verify their identities before their commits can be accepted. This step is not required if contributors will be submitting changes via GitHub.com itself since users will have verified their identities with GitHub's own verification process.
To reiterate, individuals contributing via command line will need to sign their commits through SSH. Signing GitHub commits helps ProLUG validate incoming commits from trusted contributors that reside outside the GitHub ecosystem. It can be quite trivial to impersonate users on GitHub and it is in the best interest of the project and contributors to observe this security practice.
It should also be noted that GitHub supplies tools like GitHub CLI
that abstract away the process of signing and verifying commits from the command line.
GitHub provides a gh auth login function to facilitate the procedure which contributors
can employ without the necessary changes suggested below.
To Sign your Git Commits with SSH:
Generate an SSH key pair if you don't have one:
ssh-keygen -t ed25519
Add SSH public key ('.pub' suffix) to GitHub as "Signing Key".
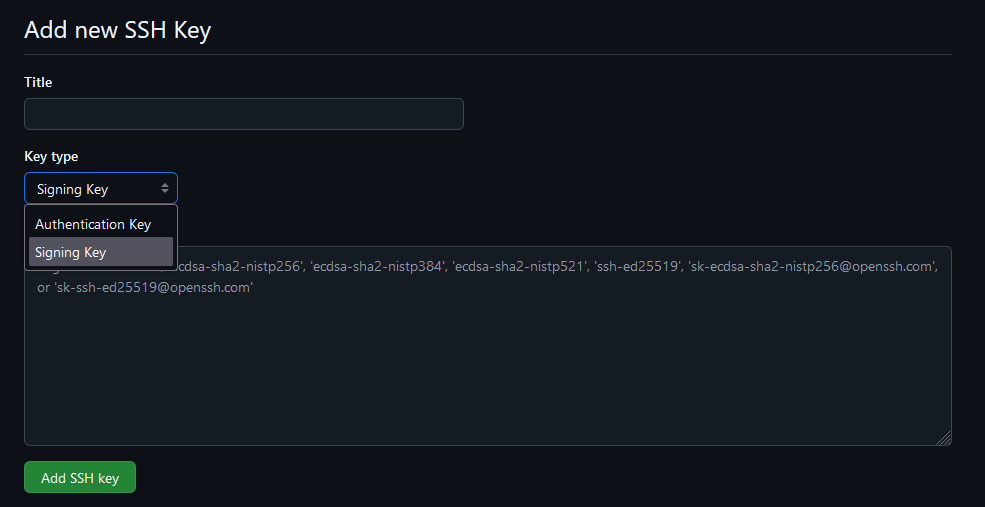
* GitHub.com -> Profile -> Settings -> GPG and SSH Keys -> Add SSH Key -> Drop down -> Signing Key
Below is a bash script that will attempt to configure signing Git commits on a localhost:
#!/bin/bash
GH_USERNAME="YourUsername"
git config --global gpg.format ssh
git config --global user.signingkey ~/.ssh/id_ed25519.pub
git config --global tag.gpgSign true
git config --global commit.gpgSign true
mkdir -p ~/.config/git
touch ~/.config/git/allowed_signers
echo "${GH_USERNAME} $(cat ~/.ssh/id_ed25519.pub)" > ~/.config/git/allowed_signers
git config --global gpg.ssh.allowedSignersFile ~/.config/git/allowed_signers
# Make a commit to verify
git log --show-signature -1
Make a commit after running those commands and then use git log --show-signature -1.
You should see something like Good "git" signature for <yourname> with ED25519 key SHA256:abcdef... if it worked.

Your commits should now be verified from your account. This helps us ensure that valid users are contributing to this project. Unverified commits will be scrutinized and likely discarded.
Syncing your Fork with the Upstream ProLUG Repo

In an effort to minimize merge conflicts we strongly suggest forks remain up to date with the original repository before committing changes. This will help us reduce pull request management overhead.
You can do this from the GitHub web UI easily with the Sync Fork button. If you want to do this from the terminal, you can add a new git remote called upstream.
git remote add upstream https://github.com/ProfessionalLinuxUsersGroup/lac.git
Then, to sync your local fork with the original repo, do a git pull from the upstream remote.
git pull upstream main
This fork should now be up to date with the original upstream repository.
Basic Contribution Workflow
You'll create your own fork of the repository using the GitHub web UI, create a branch, make changes, push to your fork, then open a pull request.
Comment First
If you'd like to work on a specific worksheet or lab, please let us know first by commenting on the issue so you can be assigned to it. This way, other contributors can see that someone is already working on it.
This helps the repository maintainers and contributors attain a high degree of visibility and collaboration before merging changes.
Create a Fork
Go to the original repository link. Click on "Fork" on the top right. Now you'll have your own version of the repository that you can clone.
git clone git@github.com:YOUR_USERNAME/lac.git
# Or, with https:
git clone https://github.com/YOUR_USERNAME/lac.git
Clone the Fork to your Local Machine
Then you'll need to clone your fork down to your local machine in order to work on it.
git clone git@github.com:yourname/lac.git
Create a New Branch
Whenever making changes contributors are highly encouraged to create a branch with an appropriate name. Switch to that branch, then make changes there.
For example, if you're working on the Unit 1 Worksheet:
git branch unit1-worksheet
git switch unit1-worksheet
# Or, simply:
git switch -c unit1-worksheet
Make changes to the u1ws.md.
Consider a few Useful Practices
The practices presented below are not required to contribute to the ProLUG course books but can streamline contributing to any project and are considered to some as best practice or incredibly useful when engaging in version control with Git.
Git Rebasing
Proper implementation of rebasing can leave a clean, and easily readable commit history for all concerned parties. Rebasing can also facilitate the management of branches and working directories in a notably active project.
The Git documentation provides a succinct explanation of its utility but also how it could potentially ruin a project and erase the work of other contributors.
Rebasing also plays a role in facilitating any commit reverts that may need to be made in the future. More on that will follow.
Git Rebasing documentation: https://git-scm.com/book/en/v2/Git-Branching-Rebasing
Commit Early, Often, and Squashing Commits
It is great practice to commit early, and often. This however can produce hard to read commits for repo maintainers and contributors. Squashing commits, which is a type of rebasing, can be utilized to compress a large number of commits made in a local repository before being pushed into a remote repository and eventual pull requests.
Below is an example of 4 local commits squashed into a single commit that was pushed remotely:
Squashing commits can improve readability, but its primary utility, especially for larger projects, may be in addressing an event where rolling back several commits due to a bug or test can be done with a single commit revert.
freeCodeCamp has a great write-up on this procedure. When done appropriately this can greatly facilitate the development process. Contributors are strongly encouraged to begin exploring these types of workflows if they never have.
Git Stashing
Another useful practice is to employ "stashing" uncommitted files in a local repository. This is useful in many contexts including stashing local changes to resolve recently introduced remote vs. local repo conflicts, or quickly switching working spaces.
Stashing effectively unstages any changes made in the local repo and saves them to be applied later. This can further help facilitate a rebase or merge before committing changes upstream for instance.
https://www.atlassian.com/git/tutorials/saving-changes/git-stash
https://git-scm.com/book/en/v2/Git-Tools-Stashing-and-Cleaning
Commit and Push your Changes
First make sure your forked repo is up-to-date with the original. Create your commit (make sure it's signed!), then push changes to your own fork on the new branch.
git commit -m "descriptive commit message"
git push origin unit1-worksheet
Comment your Changes
Before creating a pull request, make a comment on the issue containing your changes. We're doing this since the GitHub organization feature is paid and we are doing this for free, so there is only one person who is able to merge pull requests at the moment.
Create a Pull Request
Now you'll be able to go to the original repository link and go to the "Pull Requests" tab and create a new pull request.
Select your branch unit1-worksheet, and create a description and mention an issue by number (e.g., #5).
Supporting Material
Below are links to the necessary materials to build out the course templates:
- Look over the template pages wiki, or directly here:
Ancillary unit videos provided by Scott:
PDF and docs directly related to each Unit of the course:
It is strongly encouraged that contributors test their changes before making commits. To help facilitate this process a set of instructions and guidelines are provided below. These guidelines are by no means a requirement or the only set of procedures to locally develop on this project.
The examples, code, and commands provided below were developed using such technologies as containers, bash scripts, and more.
Build Dependencies
The ProLUG Linux Administration Course (LAC) utilizes mdBook (markdown Book), a friendly and popular markdown utility that quickly exports static web files for documentation or general website use cases.
Utilizing mdBook this course then deploys the exported web structure to a Git Pages workflow and runner that then produces an easily navigable website.
Below is the current workflow that deploys the Git Page for the course:
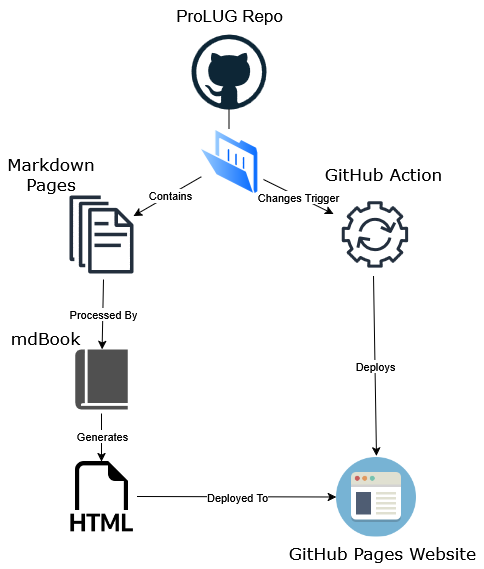
To achieve this deployment locally the following environment and dependencies are required:
-
A localhost, this could be a container, virtual machine, or local machine
-
The following packages installed on such machine:
- httpd or apache
- git
- mdBook binary
-
And a clone of a ProLUG repository
Building, Deploying, and Developing Locally
Below is a set of scripts that can quickly achieve this environment in an automated fashion.
These commands assume a root user. This script will update and upgrade host packages to
their latest versions, install git, curl, tar, gzip, grep and their dependencies if they aren't present,
attempt to pull down the latest fully compiled mdbook binary from the official mdBook GitHub repository, boot
up the local web server, process and produce the necessary .html files from the LAC source files, deploy
the website and necessary cleanup operations.
Outside of system packages all files will be localized to the /root/lac directory on the container or machine.
APT frontends:
#!/bin/bash
apt-get -y install apache2 git curl tar gzip grep
cd && git clone https://github.com/ProfessionalLinuxUsersGroup/lac && cd $HOME/lac
VERSION=$(curl -sL https://github.com/rust-lang/mdBook/releases/latest | grep -Po -m 1 'v(?:\d\.){2}\d+')
curl -sLO "https://github.com/rust-lang/mdBook/releases/download/${VERSION}/mdbook-${VERSION}-x86_64-unknown-linux-gnu.tar.gz"
tar xfz mdbook-${VERSION}-x86_64-unknown-linux-gnu.tar.gz
rm -f mdbook-${VERSION}-x86_64-unknown-linux-gnu.tar.gz
systemctl enable --now apache2
$PWD/mdbook build -d /var/www/html
systemctl restart apache2
unset VERSION
DNF frontends:
#!/bin/bash
dnf install -y httpd git curl tar gzip grep
cd && git clone https://github.com/ProfessionalLinuxUsersGroup/lac && cd $HOME/lac
VERSION=$(curl -sL https://github.com/rust-lang/mdBook/releases/latest | grep -Po -m 1 'v(?:\d\.){2}\d+')
curl -sLO "https://github.com/rust-lang/mdBook/releases/download/${VERSION}/mdbook-${VERSION}-x86_64-unknown-linux-gnu.tar.gz"
tar xfz mdbook-${VERSION}-x86_64-unknown-linux-gnu.tar.gz
rm -f mdbook-${VERSION}-x86_64-unknown-linux-gnu.tar.gz
systemctl enable --now httpd
$PWD/mdbook build -d /var/www/html
systemctl restart httpd
unset VERSION
The ProLUG Linux Administration Course website should now be available from your web browser either at http://localhost or its designated IP address.
From here you can use such commands from your localhost to implement changes:
cd {working lac directory} #for example: /root/lac or ~/lac
$HOME/lac/mdbook build -d /var/www/html
systemctl restart {httpd or apache}
These commands will switch your shell into the appropriate directory, execute the necessary cargo binaries located in its installed PATH, build the mdBook from any files that were changed, and then finally restart the web server.
From there you should be able to see any changes you have made are reflected.
Or send commands over to a networked container or machine:
Note: To minimize complexity and given the nature of commands over SSH, these commands will need to utilize absolute paths.
scp {working directory}/{targeted document} {TARGET_IP}:/root/lac/src/{targeted document}
ssh {TARGET_IP} "cd /root/lac && /root/lac/mdbook build -d /var/www/html && systemctl restart httpd"
An example of the workflow after making changes:
scp src/development.md 172.16.15.8:/root/lac/src/
ssh 172.16.15.8 "cd /root/lac && /root/lac/mdbook build -d /var/www/html && systemctl restart httpd"
Unit 1
- 📥 Download (.txt) - Worksheet
- 📥 Download (.docx) - Worksheet
- 📥 Download (.txt) - Lab
- 📥 Download (.docx) - Lab
- 📥 Download (.pdf) - Lab
Unit 2
- 📥 Download (.txt) - Worksheet
- 📥 Download (.docx) - Worksheet
- 📥 Download (.txt) - Lab
- 📥 Download (.docx) - Lab
Unit 3
- 📥 Download (.txt) - Worksheet
- 📥 Download (.docx) - Worksheet
- 📥 Download (.pdf) - Lab
- 📥 Download (.txt) - Lab
- 📥 Download (.docx) - Lab
Unit 4
- 📥 Download (.txt) - Worksheet
- 📥 Download (.docx) - Worksheet
- 📥 Download (.pdf) - Lab
- 📥 Download (.txt) - Lab
- 📥 Download (.docx) - Lab
Unit 5
- 📥 Download (.pdf) - Lab
- 📥 Download (.docx) - Lab
- 📥 Download (.txt) - Lab
- 📥 Download (.txt) - Worksheet
- 📥 Download (.docx) - Worksheet
Unit 6
- 📥 Download (.txt) - Worksheet
- 📥 Download (.docx) - Worksheet
- 📥 Download (.txt) - Lab
- 📥 Download (.docx) - Lab
- 📥 Download (.pdf) - Lab
Unit 7
- 📥 Download (.pdf) - Lab
- 📥 Download (.docx) - Lab
- 📥 Download (.txt) - Lab
- 📥 Download (.txt) - Worksheet
- 📥 Download (.docx) - Worksheet
Unit 8
- 📥 Download (.txt) - Worksheet
- 📥 Download (.docx) - Worksheet
- 📥 Download (.docx) - Lab
- 📥 Download (.txt) - Lab
Unit 9
- 📥 Download (.pdf) - Worksheet
- 📥 Download (.docx) - Worksheet
- 📥 Download (.txt) - Worksheet
- 📥 Download (.pdf) - Lab
- 📥 Download (.docx) - Lab
- 📥 Download (.txt) - Lab
Unit 10
- 📥 Download (.docx) - Lab
- 📥 Download (.pdf) - Lab
- 📥 Download (.docx) - Worksheet
- 📥 Download (.pdf) - Worksheet
Unit 11
- 📥 Download (.pdf) - Lab
- 📥 Download (.docx) - Lab
- 📥 Download (.docx) - Worksheet
- 📥 Download (.pdf) - Worksheet
Unit 12
- 📥 Download (.docx) - Lab
- 📥 Download (.pdf) - Lab
- 📥 Download (.pdf) - Worksheet
- 📥 Download (.docx) - Worksheet
Unit 13
- 📥 Download (.pdf) - Lab
- 📥 Download (.docx) - Lab
- 📥 Download (.pdf) - Worksheet
- 📥 Download (.docx) - Worksheet
Unit 14
- 📥 Download (.pdf) - Lab
- 📥 Download (.docx) - Lab
- 📥 Download (.pdf) - Worksheet
- 📥 Download (.docx) - Worksheet
Unit 15
- 📥 Download (.pdf) - Lab
- 📥 Download (.docx) - Lab
- 📥 Download (.pdf) - Worksheet
- 📥 Download (.docx) - Worksheet
Unit 16
- 📥 Download (.docx) - Lab
- 📥 Download (.pdf) - Lab
Socratic Linux
Can you list the number of CPUs?
lscpunproccat /proc/cpuinfo | grep -i procpython3 -c "import multiprocessing as mp; print(mp.cpu_count())"
Can you tell me the speed in MHz?
dmesg | grep -i mhzlscpucat /proc/cpuinfo
Can you tell me the manufacturer of the chip?
lscpucat /proc/cpuinfolshw | grep -i intel
Can you tell the architecture of this chip?
lscpuuname -m
Can you tell me if this system is physical or virtual?
lshw -C systemdmidecode -s system-manufacturervirt-whatlspci #look for something like QEMUsystemd-detect-virt
Can you spin up the CPU to high load for 3 minutes?
stress -c 4 --timeout 180for i in $(seq 100); do dd if=/dev/urandom bs=1024k count=5000 | bzip2 -9 > /dev/null & doneopenssl speed -multi $(nproc)
Memory Topics
Can you tell me how much RAM we have?
free -mcat /proc/meminfohtopneofetch
Can you tell me how much RAM we have used?
free -mhtop
Can you tell me how much swap we have?
free -m
Can you free all of the cached memory?
echo 3 > /proc/sys/vm/drop_caches
Can you generate high memory load for 3 minutes?
stress --vm 4 --timeout 180s
Filesystem Topics
Can you show all of the used space of the / (root) partition?
df -h /lsblk -f
Can you show all of the inodes of the / (root) partition?
df -i /
Can you show the used space of the directory you're in?
du -sh .
Can you show all processes in the directory you're in?
lsof .
Check long listing of files, do you know the permissions?
ls -ld #Directory or file
Can you create 3 hard links to a file?
Yes - ln /tmp/testfile /tmp/otherfile1
Can you hard link to a file across filesystem boudary?
No
Cat out the file that defines mount points in the system?
cat /etc/fstabcat /etc/mtab
Speed tests of writes and reads
for i in $(seq 5); do echo "I am writing $i file"; time dd if=/dev/zero of=bigfile$i bs=4096k count=250; donefor i in $(seq 5); do echo "I am reading $i file"; time dd if=bigfile$i of=/dev/null; done
Can you show all the interfaces?
ip aip addrifconfigip -br a
Can you show that the interface is connected physically?
ethtool enp1s0
Can you determine default route?
ip rroute
Can you ping the default gateway 3 times?
ping -c3 172.30.1.1
Can you determine the MTU of the network with ping?
ip addr #To see MTUping -c1 -s 1500 -M do www.yahoo.com
Can you identify all your IPv4 and IPv6 networks? IPv4? IPv6? Both?
ip addr-IPv4 - enp1s0 docker0-IPv6 - Calico-Both - lo flannel.1
Can you list your open ports?
netstat -ntulpss -ntulplsof -i :22
Can you prove that your DNS is working?
ping anything by name outside of network.nslookuphostdig
What file do we edit to change service to port number mapping?
/etc/services
Can we connect to another server and test for an open port?
telnetnc -vz node01 22timeout 3 nc node01 22
Can you connect to another server with ssh and show debug 3 levels?
ssh -vvv node01 'uptime'
Can we verify that nothing is blocking us to www.google.com?
curl www.google.com
Can you copy a file from this server to another and back?
scp <local file> remotenode:/<filesystem> #Sendscp remotenode:/<filesystem> <local file> #Pull
Can we capture all the packets between interfaces and put them in file?
tcpdump ip host controlplane and node01 -c 10000 -i enp1s0 -w /tmp/wireshark1.pcap
Can we test the speed between two systems?
iperf3-One node will function as the server - iperf3 -c-The other will test speed to it - iperf3 <nameofserver>
Can we show all the hops between us and google?
traceroute www.google.com
Can you show all the TCP/IP errors on an interface over one minute?
sar -n TCP,ETCP 60ifconfig
Can you list the Doom port?
grep -i doom /etc/services
Can you read from port 22 and see the banner information of the connection?
nc 127.0.0.1 22
Disk Topics
How do you check how many disks you have?
lsblklsblk -ffdisk -lls -l /dev/disk/by-*blkid
How do you check how many disk partitions you have?
lsblklsblk -ffdisl -l | grep -i vd
How do you check which filesystems are on which partitions?
lsblklsblk -f #more informationmountfindmntmount | grep -iE "ext4|xfs"
Can you check for partitions that aren't even mounted for FS Types?
lsblk -f
Can you check disk I/O over time?
bwm-ng -i diskiostat -d 1 #One second iterations foreveriostat -d 1 10 #10 one second iterationsiostat -xz #Only things that have activityiotop #By process I/O to disk
Can you verify disk read and write speed?
for i in $(seq 5); do echo "I am writing $i file"; time dd if=/dev/zero of=bigfile$i bs=4096k count=250; donefor i in $(seq 5); do echo "I am reading $i file"; time dd if=bigfile$i of=/dev/null; done
Security Topics
What users have logged into the system in the last 24 hours?
last | morelast | taclastlog | grep -v Never
Can you tell what pid is listening on port 22?
ss -ntulp | grep 22ps -ef | grep -i sshdsystemctl status sshdlsof -i :22
Can you show how systemd started sshd?
systemctl status sshsystemctl cat sshsystemd-analyze critical-chain ssh.service
Can you list the kernel modules?
lsmod
Can you verify that a file has not changed in the last 3 days?
stat /etc/crontabHashing function? #Tripwire
Can you verify the hash of a file before and after you push it to another server?
md5sum /etc/crontab; scp /etc/crontab node01:/tmp/crontab; ssh node01 'md5sum /tmp/crontab'
Can you encrypt a file with vi?
vi -x /tmp/somefile
For any user can you determine their sudo permissions?
sudo -l -U scott
For all users can you list a count of what default shells they have?
cat /etc/passwd | awk -F: '{print $7}' | sort | uniq -ccat /etc/passwd | awk -F: '{print $NF}' | sort | uniq -c
Can you verify an individual user's limits of open files?
ulimit -a -u scott
Where do you change user limits?
vi /etc/security/limits.conf
General System
Can you show me how the system was booted by grub?
dmesg | headcat /proc/cmdlinejournalctl
Can you tell me the running kernel version?
uname -rdmesg -k | headcat /proc/versioncat /proc/cmdline
Can you tell me how many older versions of the kernel are available?
ls -l /boot/vm*apt list --installed | grep linux-image
Can you show that the ssh(d) server is running?
systemctl status sshps -aux | grep sshss -ntulp | grep -i sshlsof -i : 22nc 127.0.0.1 22
Can you show how the SSH(d) process was started? What's the parent process?
ps faux | grep -i sshsystemctl status sshpstree -s -p <pid>ps -afg
Can you edit the file that changes which kernel the system boots to?
view /etc/grub/grub.conf
Can you tell me the version of Linux you're on?
cat /etc/*releaselsb_release -a
Can you describe the 7 fields of the /etc/passwd?
YesColon DelimetedUsername : Password : UID : Primary Group GUID : Comment : Home : Default Shell
Can you show me all the unique shells in /etc/passwd
cat /etc/passwd | awk -F: '{print $7}' | sort | uniq -c
Can we set one variable that is inherited by child processes and one that is not, and then prove it?
dino=rawr #not inheritedexport dino2=rawr2 #is inherited
Can you set a process to run every 5 minutes on a server?
*/5 * * * * 'echo "I love Linux" | wall'
What is the user's home directory? What is Root's home directory?
Users: /home/<username>Root: /root
Can you show all the aliases your user has available?
alias
Can you create or remove an alias?
unaliasalias
Can you tell if the user has a password set?
grep scott /etc/shadowchage -l scott
Can you create an alias and make it permanent?
.bashrc or /etc/profile.d
Do you know where the default user home directory files populate from?
/etc/skel
Can you set a script that automatically runs on any user login?
/etc/profile.d/
Can you check current users?
cat /etc/passwd
Do you know your primary and secondary groups?
id <username>
Bash Scripting
Can you touch a file with today's date in the filename?
touch file.date +%F``touch file.$(date +%F%T)
Can you create 100 files named file?
for i in $(seq 100); do touch file$i; donetouch file{1..100}count=1;while [ $count -lt 100 ]; do touch file$count; count=$((count+=1)); done
Can you show the pid of the shell you're in?
echo $$
Can you create files 1-199 skipping even numbers?
for i inseq 1 2 199; do echo "I am checking the number $i"; touch file$i; done
Can you create a variable of one data point?
var1=100
Can you loop forever watching uptime every 2 seconds
watch uptimewhile true; do uptime; sleep 2; done
Can you make your system count to 100?
seq 100seq 1 100count=1;while [ $count -le 100 ]; do echo "$count"; count=$((count+=1)); donefor ((i=1;i<=100;i++)); do echo "I am counting $i"; doneawk '{for (i=1;i<=100;++i)print i}' <<< ""perl -e '$count=0; while($count <= 100){print "$count\n"; $count++;}'perl -E 'for ($i=1; $i<=100; $i++){print "$i \n";}'perl -E 'for ($i=1; $i<=100; $i++){say $i;}'
Can you loop over lists/files?
for server in controlplane node01; do echo "I am working on server $server"; donefor server in $(cat servers); do echo "I am working on server $server"; donewhile read -r server; do echo $server; done < servers
Can you connect to two servers and show uptime in a file?
cat script.sh#!/bin/bash #################################################### # Purpose: # Date: # Name: # Revisions: #################################################### startTime=`date` sleep 10 endTime=`date` echo "The start was $startTime and the end was $endTime"
Can you test a variable against a know value?
if [ $shell == "/bin/bash" ]if [ $shell = "/bin/bash" ]
Software Packages
Can you show all the packaages that have SSL in their name?
dpkg -l | awk '{print $2}' | grep -i ssldpkg -l | gawk '/ssl/{print $2}'
Can you show when the system software was last modified?
cat /var/log/apt/history.logcat /var/log/dpkg.log | grep <tool>
Can you verify that you have a software called cowsay? If not, install it?
dpkg -l | grep -i cowsayapt install cowsay
Can we see if we have container software? Can we check for local images?
docker imagespodman images
Can run a container? Can we verify it's running? Can we verify the image?
docker run -p 8080:80 -d nginxdocker psdocker imagesto see images